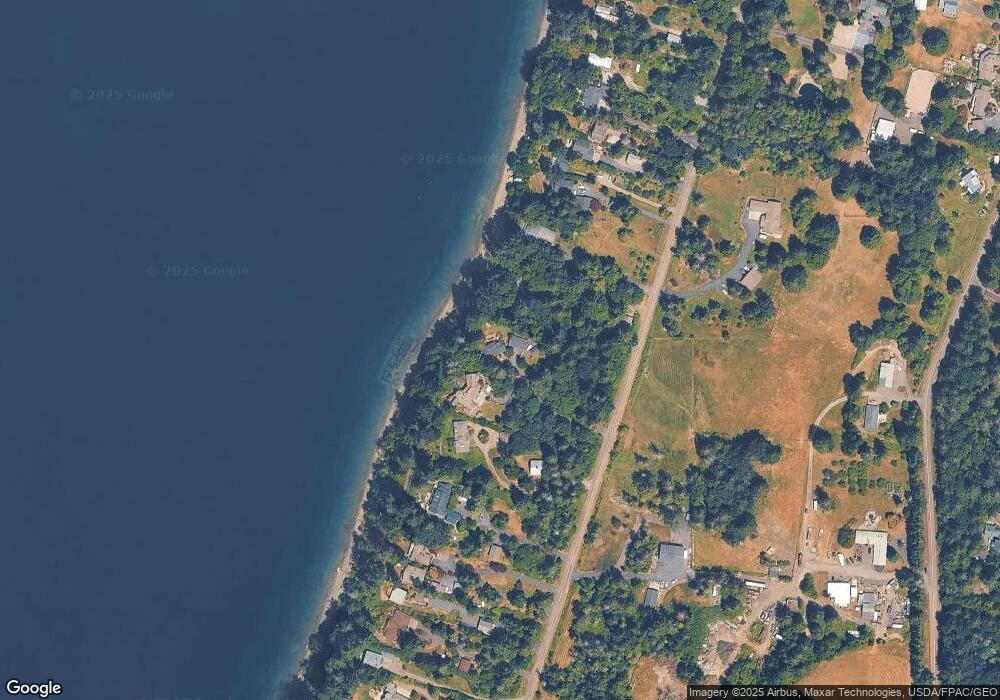
9633 Johnson Point Loop NE Olympia, WA 98516
Estimated Value: $1,077,000 - $1,178,000
3
Beds
2
Baths
2,080
Sq Ft
$534/Sq Ft
Est. Value
About This Home
This home is located at 9633 Johnson Point Loop NE, Olympia, WA 98516 and is currently estimated at $1,110,348, approximately $533 per square foot. 9633 Johnson Point Loop NE is a home located in Thurston County with nearby schools including South Bay Elementary School, Chinook Middle School, and North Thurston High School.
Ownership History
Date
Name
Owned For
Owner Type
Purchase Details
Closed on
May 26, 2000
Sold by
Lybecker Helen N
Bought by
Duncan Daniel W and Duncan Kathleen M
Current Estimated Value
Home Financials for this Owner
Home Financials are based on the most recent Mortgage that was taken out on this home.
Original Mortgage
$180,000
Outstanding Balance
$61,873
Interest Rate
7.87%
Estimated Equity
$1,048,475
Create a Home Valuation Report for This Property
The Home Valuation Report is an in-depth analysis detailing your home's value as well as a comparison with similar homes in the area
Home Values in the Area
Average Home Value in this Area
Purchase History
| Date | Buyer | Sale Price | Title Company |
|---|---|---|---|
| Duncan Daniel W | $339,500 | Chicago Title Insurance Co |
Source: Public Records
Mortgage History
| Date | Status | Borrower | Loan Amount |
|---|---|---|---|
| Open | Duncan Daniel W | $180,000 | |
| Closed | Duncan Daniel W | $85,000 |
Source: Public Records
Tax History Compared to Growth
Tax History
| Year | Tax Paid | Tax Assessment Tax Assessment Total Assessment is a certain percentage of the fair market value that is determined by local assessors to be the total taxable value of land and additions on the property. | Land | Improvement |
|---|---|---|---|---|
| 2024 | $9,545 | $1,060,400 | $522,900 | $537,500 |
| 2023 | $9,545 | $982,300 | $426,400 | $555,900 |
| 2022 | $10,360 | $975,100 | $370,500 | $604,600 |
| 2021 | $9,327 | $883,000 | $458,600 | $424,400 |
| 2020 | $8,610 | $736,200 | $406,400 | $329,800 |
| 2019 | $6,811 | $697,600 | $422,500 | $275,100 |
| 2018 | $7,627 | $559,900 | $294,400 | $265,500 |
| 2017 | $6,980 | $530,000 | $206,500 | $323,500 |
| 2016 | $6,048 | $519,100 | $211,900 | $307,200 |
| 2014 | -- | $445,600 | $207,300 | $238,300 |
Source: Public Records
Map
Nearby Homes
- 9809 Johnson Point Loop NE
- 9447 Johnson Point Loop NE
- 9913 Point View St NE
- 8939 Buttonwood Ln NE
- 8925 Libby Rd NE
- 4808 83rd Ct NE
- 8131 Kerbaugh Rd NE
- 3224 Fishtrap Loop NE
- 8031 Kerbaugh Rd NE
- 2731 Fishtrap Loop NE
- 80 E Tamarack Ln
- 8210 Walnut Rd NE
- 7118 190th Ave SW
- 123 72nd Street Ct SW
- 4803 76th Ave NE
- 17403 88th St SW
- 7644 Shore Acres Dr NE
- 8123 178th Avenue Ct SW
- 17510 88th St SW
- 8215 176th Avenue Ct SW
- 9645 Johnson Point Loop NE
- 9629 Johnson Point Loop NE
- 9703 Johnson Point Loop NE
- 9611 Johnson Point Loop NE
- 9713 Johnson Point Loop NE
- 9719 Johnson Point Loop NE
- 9601 Johnson Point Loop NE
- 9723 Johnson Point Loop NE
- 9727 Johnson Point Loop NE
- 9547 Johnson Point Loop NE
- 9704 Johnson Point Loop NE
- 9545 Johnson Point Loop NE
- 9731 Johnson Point Loop NE
- 9535 Johnson Point Loop NE
- 9735 Johnson Point Loop NE
- 9739 Johnson Point Loop NE
- 9531 Johnson Point Loop NE
- 9529 Johnson Point Loop NE
- 9743 Johnson Point Loop NE
- 9647 Johnson Point Rd NE
