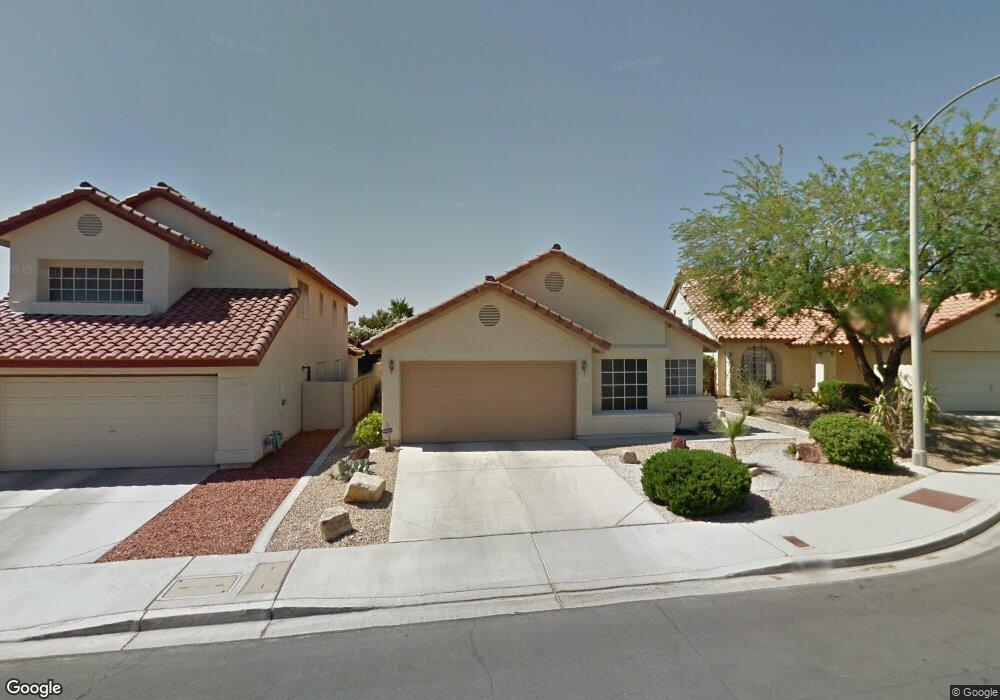
9637 Rising Tide Dr Unit 2 Las Vegas, NV 89117
The Section Seven NeighborhoodEstimated Value: $399,000 - $421,000
2
Beds
2
Baths
1,284
Sq Ft
$319/Sq Ft
Est. Value
About This Home
This home is located at 9637 Rising Tide Dr Unit 2, Las Vegas, NV 89117 and is currently estimated at $409,655, approximately $319 per square foot. 9637 Rising Tide Dr Unit 2 is a home located in Clark County with nearby schools including M J Christensen Elementary School, Clifford J Lawrence Junior High School, and Bonanza High School.
Ownership History
Date
Name
Owned For
Owner Type
Purchase Details
Closed on
Nov 5, 2003
Sold by
Diamond Edna A
Bought by
Diamond Edna A and Howard B & Edna A Diamond Revocable Livi
Current Estimated Value
Home Financials for this Owner
Home Financials are based on the most recent Mortgage that was taken out on this home.
Original Mortgage
$165,165
Outstanding Balance
$76,705
Interest Rate
6.14%
Mortgage Type
FHA
Estimated Equity
$332,950
Purchase Details
Closed on
Sep 25, 2003
Sold by
Diamond Edna A
Bought by
Nichols James Craig
Home Financials for this Owner
Home Financials are based on the most recent Mortgage that was taken out on this home.
Original Mortgage
$165,165
Outstanding Balance
$76,705
Interest Rate
6.14%
Mortgage Type
FHA
Estimated Equity
$332,950
Purchase Details
Closed on
Oct 5, 1997
Sold by
Diamond Howard B and Diamond Edna A
Bought by
Diamond Howard B and Diamond Edna A
Create a Home Valuation Report for This Property
The Home Valuation Report is an in-depth analysis detailing your home's value as well as a comparison with similar homes in the area
Home Values in the Area
Average Home Value in this Area
Purchase History
| Date | Buyer | Sale Price | Title Company |
|---|---|---|---|
| Diamond Edna A | -- | -- | |
| Nichols James Craig | $167,500 | United Title Of Nevada | |
| Diamond Howard B | -- | -- | |
| Diamond Howard B | -- | -- |
Source: Public Records
Mortgage History
| Date | Status | Borrower | Loan Amount |
|---|---|---|---|
| Open | Nichols James Craig | $165,165 |
Source: Public Records
Tax History Compared to Growth
Tax History
| Year | Tax Paid | Tax Assessment Tax Assessment Total Assessment is a certain percentage of the fair market value that is determined by local assessors to be the total taxable value of land and additions on the property. | Land | Improvement |
|---|---|---|---|---|
| 2025 | $2,243 | $82,611 | $38,150 | $44,461 |
| 2024 | $2,078 | $82,611 | $38,150 | $44,461 |
| 2023 | $2,078 | $74,550 | $31,850 | $42,700 |
| 2022 | $1,924 | $66,427 | $26,950 | $39,477 |
| 2021 | $1,782 | $64,699 | $26,950 | $37,749 |
| 2020 | $1,651 | $63,565 | $25,900 | $37,665 |
| 2019 | $1,548 | $60,101 | $22,750 | $37,351 |
| 2018 | $1,477 | $55,984 | $19,600 | $36,384 |
| 2017 | $1,804 | $55,003 | $17,850 | $37,153 |
| 2016 | $1,383 | $52,806 | $15,400 | $37,406 |
| 2015 | $1,380 | $42,733 | $11,200 | $31,533 |
| 2014 | $1,339 | $43,141 | $7,000 | $36,141 |
Source: Public Records
Map
Nearby Homes
- 3213 Shallow Point Cir
- 9741 Horizon Hills Dr
- 3381 Biscayne Bay Dr
- 9888 Sparrow Ridge Ave
- 9820 Cross Creek Way
- 9651 Stoney Creek Dr
- 9857 Pioneer Ave
- 9931 Sparrow Ridge Ave
- 9833 Dardanelle Ct
- 9624 Beach Water Cir
- 9548 Wooden Pier Way
- 9504 Cliff View Way
- 9605 Blowing Sand Cir
- 9717 Sierra Mesa Ave
- 3044 Forest Lake St
- 9905 Fox Springs Dr
- 9677 Casper Peak Ct
- 9750 Pine Thickett Ave
- 9333 Dry Dock Dr
- 3340 Shallow Pond Dr
- 9633 Rising Tide Dr
- 9641 Rising Tide Dr Unit 2
- 9629 Rising Tide Dr Unit none
- 9629 Rising Tide Dr
- 9640 Swan Bay Dr
- 9632 Swan Bay Dr
- 9645 Rising Tide Dr
- 9644 Swan Bay Dr
- 9628 Swan Bay Dr
- 9625 Rising Tide Dr
- 3309 Oyster Bay St
- 9632 Rising Tide Dr
- 9636 Rising Tide Dr
- 9628 Rising Tide Dr
- 9648 Swan Bay Dr
- 9624 Swan Bay Dr
- 3305 Oyster Bay St
- 9624 Rising Tide Dr
- 3301 Oyster Bay St
- 3244 Oyster Bay St