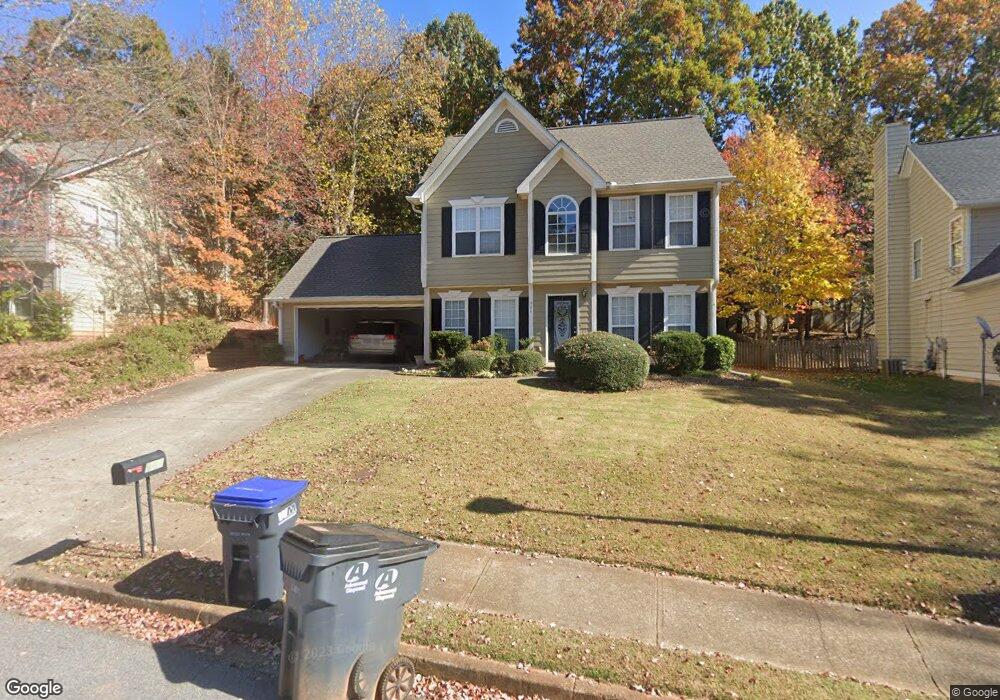
964 Bexhill Dr Lawrenceville, GA 30043
Estimated Value: $344,000 - $383,000
3
Beds
3
Baths
1,705
Sq Ft
$215/Sq Ft
Est. Value
About This Home
This home is located at 964 Bexhill Dr, Lawrenceville, GA 30043 and is currently estimated at $366,072, approximately $214 per square foot. 964 Bexhill Dr is a home located in Gwinnett County with nearby schools including McKendree Elementary School, Creekland Middle School, and Collins Hill High School.
Ownership History
Date
Name
Owned For
Owner Type
Purchase Details
Closed on
Oct 31, 2022
Sold by
Ccb International Holding Llc
Bought by
Chesterfield Capital Partner Llc
Current Estimated Value
Purchase Details
Closed on
Mar 16, 2014
Sold by
Eac Equity Management Inc
Bought by
Ccb International Holding Llc
Purchase Details
Closed on
Aug 29, 2011
Sold by
Chen Hua
Bought by
E A C Equity Management Inc
Purchase Details
Closed on
May 26, 2011
Sold by
Federal Home Loan Mortgage Corporation
Bought by
Chen Hua
Home Financials for this Owner
Home Financials are based on the most recent Mortgage that was taken out on this home.
Original Mortgage
$54,000
Interest Rate
3.75%
Mortgage Type
New Conventional
Purchase Details
Closed on
Nov 2, 2010
Sold by
Us Bk National Assn
Bought by
Federal Home Loan Mortgage Corporation
Create a Home Valuation Report for This Property
The Home Valuation Report is an in-depth analysis detailing your home's value as well as a comparison with similar homes in the area
Home Values in the Area
Average Home Value in this Area
Purchase History
| Date | Buyer | Sale Price | Title Company |
|---|---|---|---|
| Chesterfield Capital Partner Llc | -- | -- | |
| Ccb International Holding Llc | -- | -- | |
| E A C Equity Management Inc | -- | -- | |
| Chen Hua | -- | -- | |
| Federal Home Loan Mortgage Corporation | -- | -- | |
| Us Bk National Assn | $89,720 | -- |
Source: Public Records
Mortgage History
| Date | Status | Borrower | Loan Amount |
|---|---|---|---|
| Previous Owner | Chen Hua | $54,000 |
Source: Public Records
Tax History Compared to Growth
Tax History
| Year | Tax Paid | Tax Assessment Tax Assessment Total Assessment is a certain percentage of the fair market value that is determined by local assessors to be the total taxable value of land and additions on the property. | Land | Improvement |
|---|---|---|---|---|
| 2024 | $5,003 | $130,960 | $28,000 | $102,960 |
| 2023 | $5,003 | $130,960 | $28,000 | $102,960 |
| 2022 | $4,074 | $105,720 | $24,000 | $81,720 |
| 2021 | $3,325 | $83,480 | $19,600 | $63,880 |
| 2020 | $3,094 | $76,640 | $16,640 | $60,000 |
| 2019 | $2,982 | $76,640 | $16,640 | $60,000 |
| 2018 | $2,830 | $72,320 | $16,640 | $55,680 |
| 2016 | $2,231 | $54,720 | $12,880 | $41,840 |
| 2015 | $2,130 | $51,200 | $11,600 | $39,600 |
| 2014 | $2,140 | $51,200 | $11,600 | $39,600 |
Source: Public Records
Map
Nearby Homes
- 1009 Bexhill Dr
- 949 Heartwood Cir
- 1509 Hillary Cove Ct
- 1150 Hillary Ln Unit 7
- 1596 Poplarwood Ln Unit 2
- 1415 Hillary Cove Terrace
- 902 Heartwood Cir
- 908 Lance Cir
- 1470 Gabriel Dr Unit 1
- 1059 Mount Water Ln
- 1414 Justin Dr
- 1478 Fairview Trail
- 1830 McKendree Lake Dr
- 940 Meadowsong Cir
- 870 Meadowsong Cir
- 1811 Hayden Mill Ct
- 1112 Hopedale Ln
- 954 Bexhill Dr
- 974 Bexhill Dr
- 1080 Prestonwood Dr
- 944 Bexhill Dr Unit 4
- 1090 Prestonwood Dr
- 888 Whitehaven Ct
- 969 Bexhill Dr
- 1595 Bexhill Ct Unit 23
- 1595 Bexhill Ct
- 1595 Bexhill Ct Unit IV
- 1585 Bexhill Ct
- 959 Bexhill Dr Unit 36
- 959 Bexhill Dr
- 934 Bexhill Dr
- 1070 Prestonwood Dr
- 898 Whitehaven Ct
- 898 Whitehaven Ct Unit IV
- 878 Whitehaven Ct
- 949 Bexhill Dr
- 1095 Prestonwood Dr