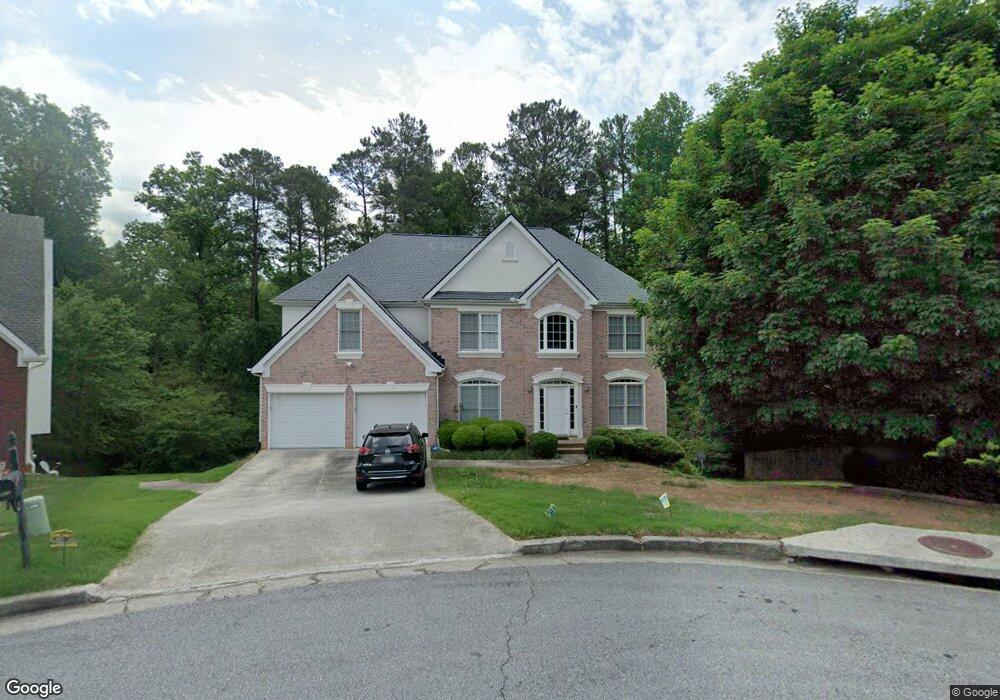
964 Cedar Crest Ct SW Unit 5 Lilburn, GA 30047
Estimated Value: $593,000 - $679,000
5
Beds
4
Baths
3,188
Sq Ft
$195/Sq Ft
Est. Value
About This Home
This home is located at 964 Cedar Crest Ct SW Unit 5, Lilburn, GA 30047 and is currently estimated at $622,741, approximately $195 per square foot. 964 Cedar Crest Ct SW Unit 5 is a home located in Gwinnett County with nearby schools including Camp Creek Elementary School, Trickum Middle School, and Parkview High School.
Ownership History
Date
Name
Owned For
Owner Type
Purchase Details
Closed on
Dec 8, 2023
Sold by
Khoja Rahim
Bought by
Khoja Meherbano
Current Estimated Value
Purchase Details
Closed on
May 2, 2022
Sold by
Khoja Sofia
Bought by
Khoja Rahim
Purchase Details
Closed on
Oct 8, 2013
Sold by
Khoja Meherbano
Bought by
Khoja Rahim and Khoja Sofia
Purchase Details
Closed on
Apr 29, 2004
Sold by
Kelsey Joshua
Bought by
Khoja Meherbano
Home Financials for this Owner
Home Financials are based on the most recent Mortgage that was taken out on this home.
Original Mortgage
$175,000
Interest Rate
5.98%
Mortgage Type
New Conventional
Purchase Details
Closed on
Jan 27, 2000
Sold by
Nash Properties Inc
Bought by
Kelsey Joshua A
Home Financials for this Owner
Home Financials are based on the most recent Mortgage that was taken out on this home.
Original Mortgage
$216,400
Interest Rate
8.29%
Mortgage Type
New Conventional
Create a Home Valuation Report for This Property
The Home Valuation Report is an in-depth analysis detailing your home's value as well as a comparison with similar homes in the area
Home Values in the Area
Average Home Value in this Area
Purchase History
| Date | Buyer | Sale Price | Title Company |
|---|---|---|---|
| Khoja Meherbano | -- | -- | |
| Khoja Rahim | -- | -- | |
| Khoja Rahim | -- | -- | |
| Khoja Meherbano | $334,900 | -- | |
| Kelsey Joshua A | $270,500 | -- |
Source: Public Records
Mortgage History
| Date | Status | Borrower | Loan Amount |
|---|---|---|---|
| Previous Owner | Khoja Meherbano | $175,000 | |
| Previous Owner | Kelsey Joshua A | $216,400 |
Source: Public Records
Tax History Compared to Growth
Tax History
| Year | Tax Paid | Tax Assessment Tax Assessment Total Assessment is a certain percentage of the fair market value that is determined by local assessors to be the total taxable value of land and additions on the property. | Land | Improvement |
|---|---|---|---|---|
| 2025 | $3,875 | $245,280 | $38,680 | $206,600 |
| 2024 | $3,882 | $247,240 | $38,680 | $208,560 |
| 2023 | $3,882 | $241,640 | $45,040 | $196,600 |
| 2022 | $4,500 | $211,080 | $33,840 | $177,240 |
| 2021 | $4,990 | $164,160 | $29,840 | $134,320 |
| 2020 | $5,950 | $154,840 | $25,840 | $129,000 |
| 2019 | $4,229 | $154,840 | $25,840 | $129,000 |
| 2018 | $4,857 | $129,640 | $21,440 | $108,200 |
| 2016 | $4,284 | $112,840 | $21,440 | $91,400 |
| 2015 | $4,334 | $112,840 | $21,440 | $91,400 |
| 2014 | $3,506 | $112,840 | $21,440 | $91,400 |
Source: Public Records
Map
Nearby Homes
- 1017 Rolling Forest Ln
- 4271 Weston Dr SW
- 4449 Amberleaf Walk
- 1296 Mandalay Ct SW
- 1093 Hasty Ct SW
- 4367 Cedar Wood Dr SW
- 4254 Cedar Creek Trail SW Unit 8
- 4245 Cedar Creek Trail SW
- 4307 Cedar Wood Dr SW
- 871 Cedar Trace SW
- 1043 Wash Lee Dr SW
- 676 Killian Hill Rd SW
- 772 Brookwood Terrace SW
- 753 Brookwood Terrace SW
- 4582 Warrior Trail SW
- 4327 Saint Michaels Dr SW
- 954 Cedar Crest Ct SW Unit 5
- 974 Cedar Crest Ct SW
- 975 Cedar Crest Ct SW
- 975 Cedar Crest Ct SW Unit 975
- 975 Cedar Crest Ct SW
- 944 Cedar Crest Ct SW Unit 5
- 955 Cedar Crest Ct SW Unit 5
- 945 Cedar Crest Ct SW
- 934 Cedar Crest Ct SW
- 925 Cedar Crest Ct SW Unit 5
- 948 Cedar Falls Ct SW Unit 5
- 938 Cedar Falls Ct SW Unit 5
- 0 Cedar Crest Ct SW Unit 7060952
- 928 Cedar Falls Ct SW
- 0 Cedar Falls Ct SW Unit 7197372
- 0 Cedar Falls Ct SW Unit 3153951
- 0 Cedar Falls Ct SW Unit 8194415
- 0 Cedar Falls Ct SW Unit 7601803
- 0 Cedar Falls Ct SW
- 924 Cedar Crest Ct SW