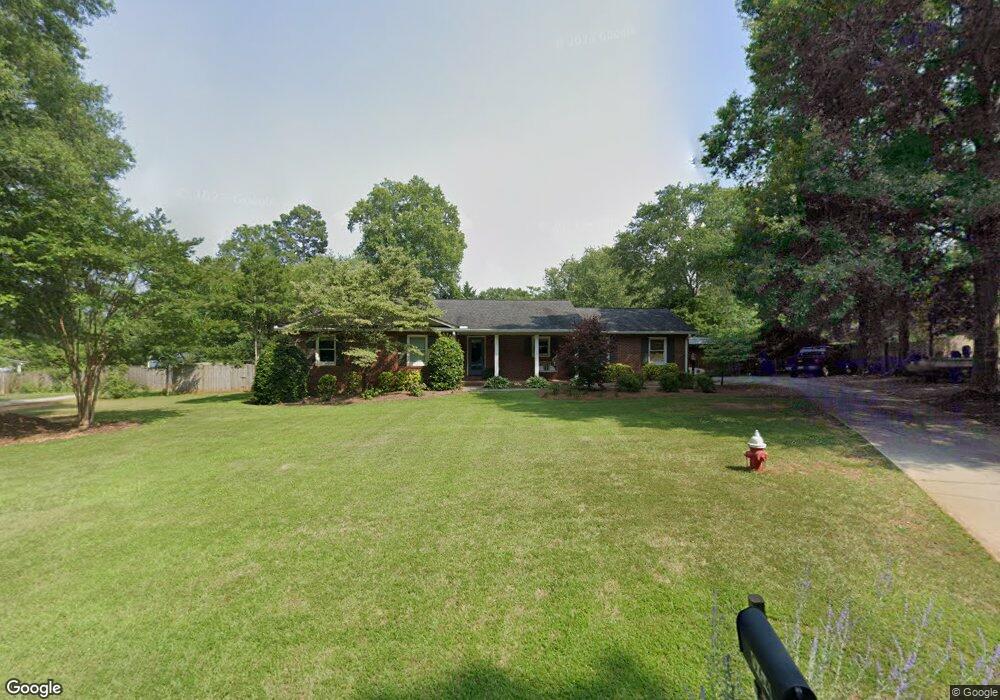
964 Harper St Madison, GA 30650
Estimated Value: $481,000 - $714,000
--
Bed
2
Baths
2,234
Sq Ft
$251/Sq Ft
Est. Value
About This Home
This home is located at 964 Harper St, Madison, GA 30650 and is currently estimated at $561,438, approximately $251 per square foot. 964 Harper St is a home located in Morgan County with nearby schools including Morgan County Primary School, Morgan County Elementary School, and Morgan County Middle School.
Ownership History
Date
Name
Owned For
Owner Type
Purchase Details
Closed on
Feb 22, 2021
Sold by
Ianelli Ellen
Bought by
Sims Ellen Dow Martin and Sims Patrick Elrod
Current Estimated Value
Home Financials for this Owner
Home Financials are based on the most recent Mortgage that was taken out on this home.
Original Mortgage
$211,500
Outstanding Balance
$189,164
Interest Rate
2.7%
Mortgage Type
New Conventional
Estimated Equity
$372,275
Purchase Details
Closed on
Mar 16, 2015
Sold by
Pritchard William B
Bought by
Ianelli Ellen and Sims Patrick Elrod
Home Financials for this Owner
Home Financials are based on the most recent Mortgage that was taken out on this home.
Original Mortgage
$231,990
Interest Rate
3.37%
Mortgage Type
FHA
Purchase Details
Closed on
May 2, 2001
Sold by
Pritchard William B
Bought by
Pritchard William B
Purchase Details
Closed on
May 30, 1990
Sold by
Fleeman Bobby
Bought by
Pritchard William B
Create a Home Valuation Report for This Property
The Home Valuation Report is an in-depth analysis detailing your home's value as well as a comparison with similar homes in the area
Home Values in the Area
Average Home Value in this Area
Purchase History
| Date | Buyer | Sale Price | Title Company |
|---|---|---|---|
| Sims Ellen Dow Martin | -- | -- | |
| Ianelli Ellen | $240,000 | -- | |
| Pritchard William B | -- | -- | |
| Pritchard William B | $79,000 | -- |
Source: Public Records
Mortgage History
| Date | Status | Borrower | Loan Amount |
|---|---|---|---|
| Open | Sims Ellen Dow Martin | $211,500 | |
| Previous Owner | Ianelli Ellen | $231,990 |
Source: Public Records
Tax History Compared to Growth
Tax History
| Year | Tax Paid | Tax Assessment Tax Assessment Total Assessment is a certain percentage of the fair market value that is determined by local assessors to be the total taxable value of land and additions on the property. | Land | Improvement |
|---|---|---|---|---|
| 2024 | $3,486 | $125,661 | $18,000 | $107,661 |
| 2023 | $3,344 | $117,243 | $18,000 | $99,243 |
| 2022 | $3,164 | $107,040 | $11,800 | $95,240 |
| 2021 | $3,141 | $105,860 | $11,800 | $94,060 |
| 2020 | $3,029 | $101,157 | $11,800 | $89,357 |
| 2019 | $3,077 | $101,157 | $11,800 | $89,357 |
| 2018 | $3,119 | $101,157 | $11,800 | $89,357 |
| 2017 | $2,912 | $91,528 | $8,400 | $83,128 |
| 2016 | $3,075 | $96,019 | $11,800 | $84,219 |
| 2015 | $3,245 | $99,880 | $10,480 | $89,400 |
| 2014 | $2,583 | $81,840 | $10,000 | $71,840 |
| 2013 | -- | $61,720 | $10,000 | $51,720 |
Source: Public Records
Map
Nearby Homes
- 943 Harper St
- 962 Saye Creek Dr
- 1027 Harper St
- 679 College Dr
- 1550 Athens Hwy
- 824 East Ave
- 766 East Ave
- 370 Park St Unit 8
- 1050 Madison Hills Dr Unit 2
- 1080 Madison Hills Dr
- 1040 Madison Hills Dr
- 1060 Madison Hills Dr
- 1040 Madison Hills Dr Unit 1
- 1060 Madison Hills Dr Unit 3
- 1080 Madison Hills Dr Unit 5
- 1355 Veranda Park Dr
- 172 N Second St
- 1365 Veranda Park Dr
- 952 Harper St
- 976 Harper St Unit 13
- 976 Harper St
- 0 Harper St Unit 8527073
- 0 Harper St Unit 7128603
- 0 Harper St Unit 3165801
- 0 Harper St Unit 3277423
- 0 Harper St Unit 3284970
- 0 Harper St Unit 7616326
- 0 Harper St Unit 8126353
- 0 Harper St
- 993 Saye Creek Dr
- 985 Saye Creek Dr
- 951 Harper St
- 1001 Saye Creek Dr
- 977 Saye Creek Dr
- 975 Harper St
- 988 Harper St
- 969 Saye Creek Dr
- 0 Saye Creek Dr Unit 8306952