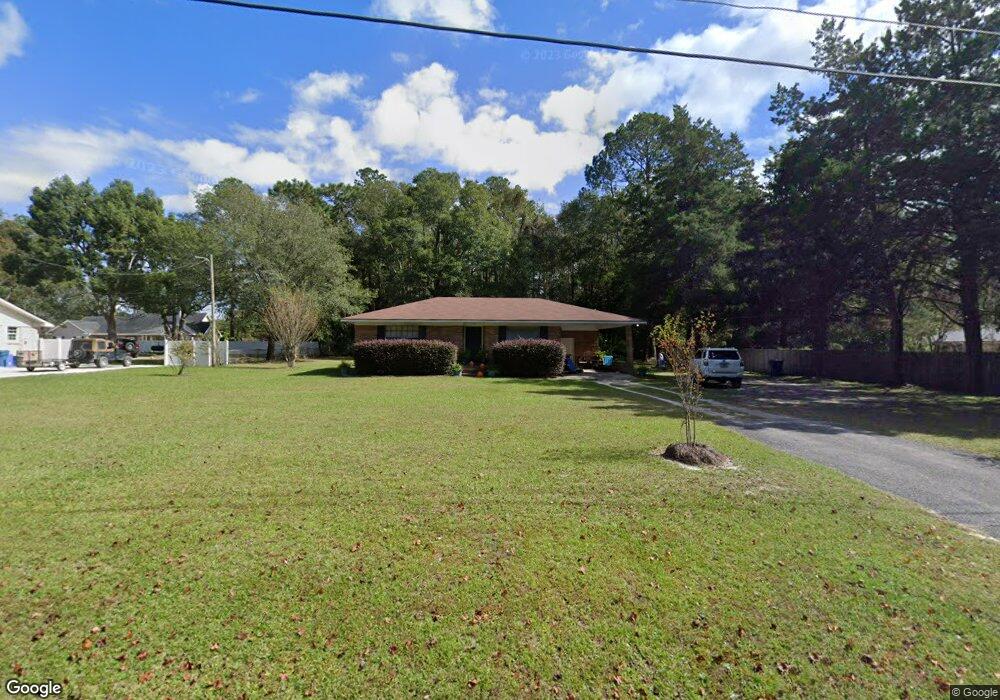
964 Highland Dr Waycross, GA 31503
Estimated Value: $135,391 - $213,000
2
Beds
1
Bath
1,008
Sq Ft
$167/Sq Ft
Est. Value
About This Home
This home is located at 964 Highland Dr, Waycross, GA 31503 and is currently estimated at $168,348, approximately $167 per square foot. 964 Highland Dr is a home located in Ware County with nearby schools including Williams Heights Elementary School, Waycross Middle School, and Ware County High School.
Ownership History
Date
Name
Owned For
Owner Type
Purchase Details
Closed on
Aug 17, 2018
Sold by
Craven Brittany A
Bought by
Craven Brittany A and Craven Robert M
Current Estimated Value
Home Financials for this Owner
Home Financials are based on the most recent Mortgage that was taken out on this home.
Original Mortgage
$60,000
Interest Rate
4.5%
Mortgage Type
New Conventional
Purchase Details
Closed on
Jun 5, 2018
Sold by
Crosby Tracy Wayne
Bought by
Origin Bank
Purchase Details
Closed on
Sep 2, 2016
Sold by
Donald
Bought by
Crosby Tracy Wayne
Home Financials for this Owner
Home Financials are based on the most recent Mortgage that was taken out on this home.
Original Mortgage
$75,578
Interest Rate
3.43%
Mortgage Type
New Conventional
Purchase Details
Closed on
Sep 11, 2008
Sold by
Jones Bronwyn S
Bought by
Courson Donald
Purchase Details
Closed on
Sep 26, 1994
Bought by
Smith Wanda T
Purchase Details
Closed on
Apr 23, 1986
Purchase Details
Closed on
Mar 11, 1985
Create a Home Valuation Report for This Property
The Home Valuation Report is an in-depth analysis detailing your home's value as well as a comparison with similar homes in the area
Home Values in the Area
Average Home Value in this Area
Purchase History
| Date | Buyer | Sale Price | Title Company |
|---|---|---|---|
| Craven Brittany A | -- | -- | |
| Craven Brittany A | $68,000 | -- | |
| Origin Bank | $64,740 | -- | |
| Crosby Tracy Wayne | $73,500 | -- | |
| Courson Donald | $65,000 | -- | |
| Smith Wanda T | -- | -- | |
| -- | -- | -- | |
| -- | $6,000 | -- |
Source: Public Records
Mortgage History
| Date | Status | Borrower | Loan Amount |
|---|---|---|---|
| Closed | Craven Brittany A | $60,000 | |
| Previous Owner | Crosby Tracy Wayne | $75,578 |
Source: Public Records
Tax History Compared to Growth
Tax History
| Year | Tax Paid | Tax Assessment Tax Assessment Total Assessment is a certain percentage of the fair market value that is determined by local assessors to be the total taxable value of land and additions on the property. | Land | Improvement |
|---|---|---|---|---|
| 2024 | $1,046 | $41,466 | $6,820 | $34,646 |
| 2023 | $1,067 | $35,658 | $3,224 | $32,434 |
| 2022 | $1,030 | $35,658 | $3,224 | $32,434 |
| 2021 | $894 | $28,492 | $3,224 | $25,268 |
| 2020 | $878 | $27,696 | $3,224 | $24,472 |
| 2019 | $772 | $23,885 | $3,224 | $20,661 |
| 2018 | $752 | $23,050 | $3,224 | $19,826 |
| 2017 | $52 | $23,050 | $3,224 | $19,826 |
| 2016 | $52 | $23,050 | $3,224 | $19,826 |
| 2015 | $52 | $23,050 | $3,224 | $19,826 |
| 2014 | $52 | $23,050 | $3,224 | $19,826 |
| 2013 | -- | $23,050 | $3,224 | $19,826 |
Source: Public Records
Map
Nearby Homes
- 3817 Central Ave
- 1072 Lawhorne Dr
- 4155 Pinecrest Rd
- 630 Saddle Cir
- 606 Stonewall Jackson Place
- 851 Carriage Ln
- 627 Saddle Cir
- 664 Saddle Cir
- 1132 Hilltop Rd
- 3070 Central Ave
- Tract 4 County-Line Rd S
- 3153 Southwood Dr
- 867 Kentland Dr
- 763 Kentland Dr
- 2775 Seminole Trail
- 4337 White Hall Church Rd
- 4337 Whitehall Church Rd
- 1049 Riverdale Dr
- 723 St Bernard Trail
- 47 +/- Acres Live Oak Ln
- 988 Highland Dr
- 4017 Central Ave
- 1012 Highland Dr
- 1047 Pope Ln
- 997 Highland Dr
- 1038 Highland Dr
- 1027 Highland Dr
- 1067 Pope Ln
- 4101 Central Ave
- 1062 Highland Dr
- 1087 Pope Ln
- 1088 Highland Dr
- 3885 Central Ave
- 1087 Highland Dr
- 3845 Central Ave
- 4102 Central Ave
- 3891 Central Ave
- 1118 Highland Dr
- 4157 Central Ave
- 801 Confederate Way