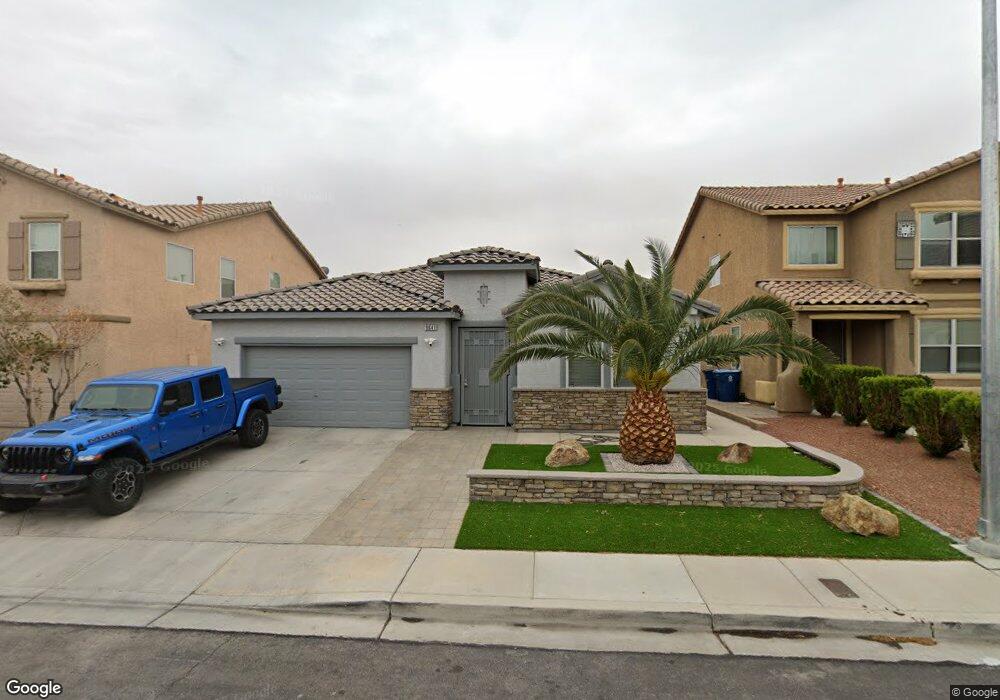
9641 Rolling Thunder Ave Las Vegas, NV 89148
Estimated Value: $504,000 - $579,000
3
Beds
2
Baths
2,164
Sq Ft
$246/Sq Ft
Est. Value
About This Home
This home is located at 9641 Rolling Thunder Ave, Las Vegas, NV 89148 and is currently estimated at $531,504, approximately $245 per square foot. 9641 Rolling Thunder Ave is a home located in Clark County with nearby schools including Shelley Berkley Elementary School, Wilbur & Theresa Faiss Middle School, and Sierra Vista High School.
Ownership History
Date
Name
Owned For
Owner Type
Purchase Details
Closed on
Mar 18, 2019
Sold by
Karapetyan Shant and Barbarian Mary
Bought by
Karapetyan Shant
Current Estimated Value
Home Financials for this Owner
Home Financials are based on the most recent Mortgage that was taken out on this home.
Original Mortgage
$120,000
Outstanding Balance
$48,104
Interest Rate
4.4%
Mortgage Type
New Conventional
Estimated Equity
$483,400
Purchase Details
Closed on
Jan 14, 2009
Sold by
Nquyen Hong Huong
Bought by
Karapetyan Shant and Barbarian Mary
Home Financials for this Owner
Home Financials are based on the most recent Mortgage that was taken out on this home.
Original Mortgage
$183,900
Interest Rate
5.6%
Mortgage Type
Unknown
Purchase Details
Closed on
Jan 20, 2004
Sold by
Beazer Homes Holdings Corp
Bought by
Nguyen Hong Huong Thi
Home Financials for this Owner
Home Financials are based on the most recent Mortgage that was taken out on this home.
Original Mortgage
$228,448
Interest Rate
5.5%
Mortgage Type
New Conventional
Create a Home Valuation Report for This Property
The Home Valuation Report is an in-depth analysis detailing your home's value as well as a comparison with similar homes in the area
Home Values in the Area
Average Home Value in this Area
Purchase History
| Date | Buyer | Sale Price | Title Company |
|---|---|---|---|
| Karapetyan Shant | -- | First American Title Ins | |
| Karapetyan Shant | $229,000 | Fidelity National Title Las | |
| Nguyen Hong Huong Thi | $285,560 | First American Title Co Of |
Source: Public Records
Mortgage History
| Date | Status | Borrower | Loan Amount |
|---|---|---|---|
| Open | Karapetyan Shant | $120,000 | |
| Closed | Karapetyan Shant | $183,900 | |
| Previous Owner | Nguyen Hong Huong Thi | $228,448 | |
| Closed | Nguyen Hong Huong Thi | $42,834 |
Source: Public Records
Tax History Compared to Growth
Tax History
| Year | Tax Paid | Tax Assessment Tax Assessment Total Assessment is a certain percentage of the fair market value that is determined by local assessors to be the total taxable value of land and additions on the property. | Land | Improvement |
|---|---|---|---|---|
| 2025 | $2,315 | $147,218 | $49,700 | $97,518 |
| 2024 | $2,248 | $147,218 | $49,700 | $97,518 |
| 2023 | $1,835 | $138,360 | $46,550 | $91,810 |
| 2022 | $2,183 | $120,715 | $36,750 | $83,965 |
| 2021 | $2,119 | $112,158 | $32,550 | $79,608 |
| 2020 | $2,055 | $109,564 | $30,800 | $78,764 |
| 2019 | $1,995 | $105,440 | $28,000 | $77,440 |
| 2018 | $1,937 | $97,621 | $23,100 | $74,521 |
| 2017 | $2,607 | $88,893 | $21,000 | $67,893 |
| 2016 | $1,835 | $82,191 | $19,250 | $62,941 |
| 2015 | $1,831 | $87,087 | $13,300 | $73,787 |
| 2014 | $1,777 | $58,785 | $9,800 | $48,985 |
Source: Public Records
Map
Nearby Homes
- 9611 Aberdeen Ridge Ct
- 9632 Abbey Pond Ave
- 6336 Fence Post St
- 9628 Scrub Jay Ct
- 9564 Fresh Crown Ct
- 9680 Waukegan Ave
- 9709 Hawk Cliff Ave
- 9624 Sage Sparrow Ave
- 9611 Sage Sparrow Ave
- 6234 Burrell Ct
- 6169 Novelty St
- 6739 Twisted Wood Dr
- 9899 Vista Meadows Ave
- 6642 Titanium Crest St
- 9889 Gemstone Sunset Ave
- 6673 Titanium Crest St
- 6125 Powdermill St
- 9928 Regency Square Ave
- 9505 Delivery Ave
- 6684 Regency Stone Way
- 9633 Rolling Thunder Ave
- 9649 Rolling Thunder Ave
- 9625 Rolling Thunder Ave
- 9657 Rolling Thunder Ave
- 9617 Rolling Thunder Ave
- 9665 Rolling Thunder Ave
- 9642 Rolling Thunder Ave
- 9634 Rolling Thunder Ave
- 9636 Aberdeen Ridge Ct
- 9642 Aberdeen Ridge Ct
- 9626 Rolling Thunder Ave
- 9626 Rolling Thunder Ave
- 9626 Rolling Thunder Ave
- 9630 Aberdeen Ridge Ct
- 9609 Rolling Thunder Ave
- 9660 Rolling Thunder Ave
- 9618 Rolling Thunder Ave
- 9673 Rolling Thunder Ave
- 9624 Aberdeen Ridge Ct
- 9668 Rolling Thunder Ave