Estimated Value: $365,000 - $404,000
3
Beds
3
Baths
2,170
Sq Ft
$180/Sq Ft
Est. Value
About This Home
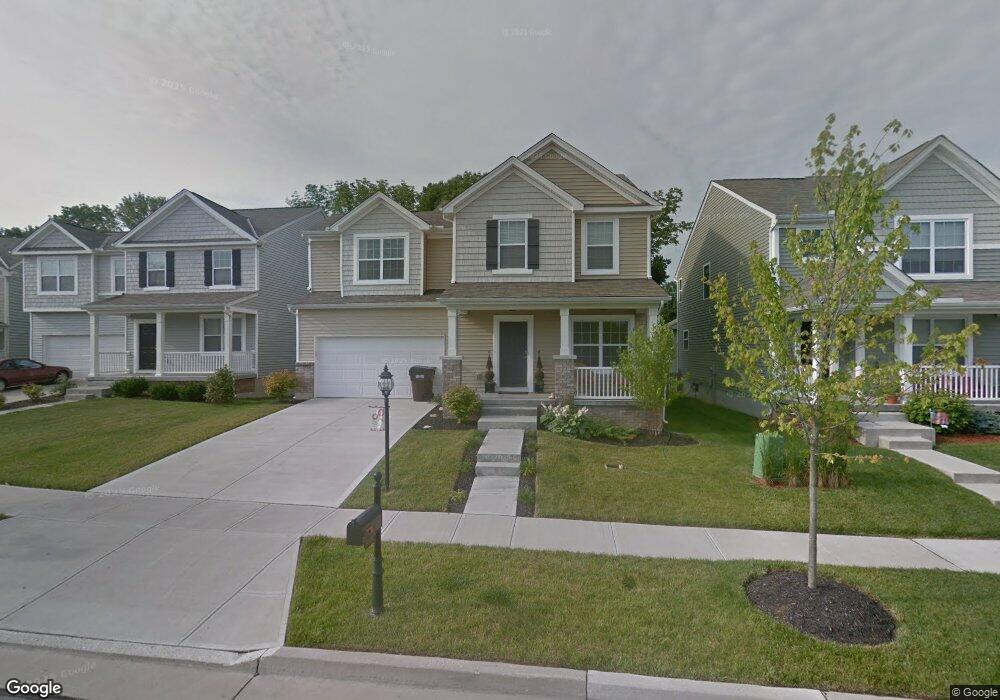
This home is located at 9645 Splendor Dr Unit 58, Union, KY 41091 and is currently estimated at $390,687, approximately $180 per square foot. 9645 Splendor Dr Unit 58 is a home located in Boone County with nearby schools including Erpenbeck Elementary School, Ockerman Middle School, and Larry A. Ryle High School.
Ownership History
Date
Name
Owned For
Owner Type
Purchase Details
Closed on
May 22, 2020
Sold by
Boone Traci L and Boone Bryan
Bought by
Clouse Anthony Wayne and Clouse Courtney Elizabeth
Current Estimated Value
Home Financials for this Owner
Home Financials are based on the most recent Mortgage that was taken out on this home.
Original Mortgage
$226,010
Outstanding Balance
$200,276
Interest Rate
3.3%
Mortgage Type
New Conventional
Estimated Equity
$190,411
Purchase Details
Closed on
Feb 18, 2011
Sold by
M/I Homes Of Cincinnati Llc
Bought by
Knight Traci L
Home Financials for this Owner
Home Financials are based on the most recent Mortgage that was taken out on this home.
Original Mortgage
$170,563
Interest Rate
4.75%
Mortgage Type
FHA
Purchase Details
Closed on
Nov 20, 2009
Sold by
The Drees Company
Bought by
M/I Homes Of Cincinnati Llc
Create a Home Valuation Report for This Property
The Home Valuation Report is an in-depth analysis detailing your home's value as well as a comparison with similar homes in the area
Home Values in the Area
Average Home Value in this Area
Purchase History
| Date | Buyer | Sale Price | Title Company |
|---|---|---|---|
| Clouse Anthony Wayne | $233,000 | Springdale Title Llc | |
| Knight Traci L | $175,765 | First Title Agency | |
| M/I Homes Of Cincinnati Llc | $266,000 | None Available |
Source: Public Records
Mortgage History
| Date | Status | Borrower | Loan Amount |
|---|---|---|---|
| Open | Clouse Anthony Wayne | $226,010 | |
| Previous Owner | Knight Traci L | $170,563 |
Source: Public Records
Tax History Compared to Growth
Tax History
| Year | Tax Paid | Tax Assessment Tax Assessment Total Assessment is a certain percentage of the fair market value that is determined by local assessors to be the total taxable value of land and additions on the property. | Land | Improvement |
|---|---|---|---|---|
| 2024 | $3,329 | $296,200 | $40,000 | $256,200 |
| 2023 | $3,371 | $296,200 | $40,000 | $256,200 |
| 2022 | $2,616 | $233,000 | $40,000 | $193,000 |
| 2021 | $2,696 | $233,000 | $40,000 | $193,000 |
| 2020 | $2,596 | $226,800 | $40,000 | $186,800 |
| 2019 | $2,036 | $175,770 | $38,000 | $137,770 |
| 2018 | $2,081 | $175,770 | $38,000 | $137,770 |
| 2017 | $2,006 | $175,770 | $38,000 | $137,770 |
| 2015 | $1,981 | $175,770 | $38,000 | $137,770 |
| 2013 | -- | $175,770 | $38,000 | $137,770 |
Source: Public Records
Map
Nearby Homes
- 3832 Sonata Dr
- 10077 Russwill Ln
- 9807 Cherbourg Dr
- 10002 Irish Way
- 8540 Concerto Ct
- 8558 Concerto Ct Unit 251C
- 8554 Concerto Ct Unit 251B
- 8550 Concerto Ct Unit 251A
- 8566 Concerto Ct
- 8554 Concerto Ct
- 8558 Concerto Ct
- 8570 Concerto Ct
- 8550 Concerto Ct
- 8520 Concerto Ct
- 8524 Concerto Ct
- 8536 Concerto Ct
- 8528 Concerto Ct
- DARDEN Plan at Harmony - Harmony Bluffs Condos
- CAYWOOD Plan at Harmony - Harmony Bluffs Condos
- ATWOOD Plan at Harmony - Harmony Bluffs Condos
- 9645 Splendor Dr
- 9641 Splendor Dr
- 9649 Splendor Dr
- 9649 Splendor Dr Unit 59
- 9637 Splendor Dr
- 9637 Splendor Dr Unit 56
- 1588 Sycamore Dr
- 9532 Sapphire Ln
- 9529 Sapphire Ln
- 9633 Splendor Dr
- 9633 Splendor Dr Unit 55
- 9528 Sapphire Ln
- 1608 Sycamore Dr
- 9525 Sapphire Ln
- 9629 Splendor Dr
- 9620 Splendor Dr
- 1578 Sycamore Dr
- 9521 Sapphire Ln
- 9520 Sapphire Ln
- 9616 Splendor Dr