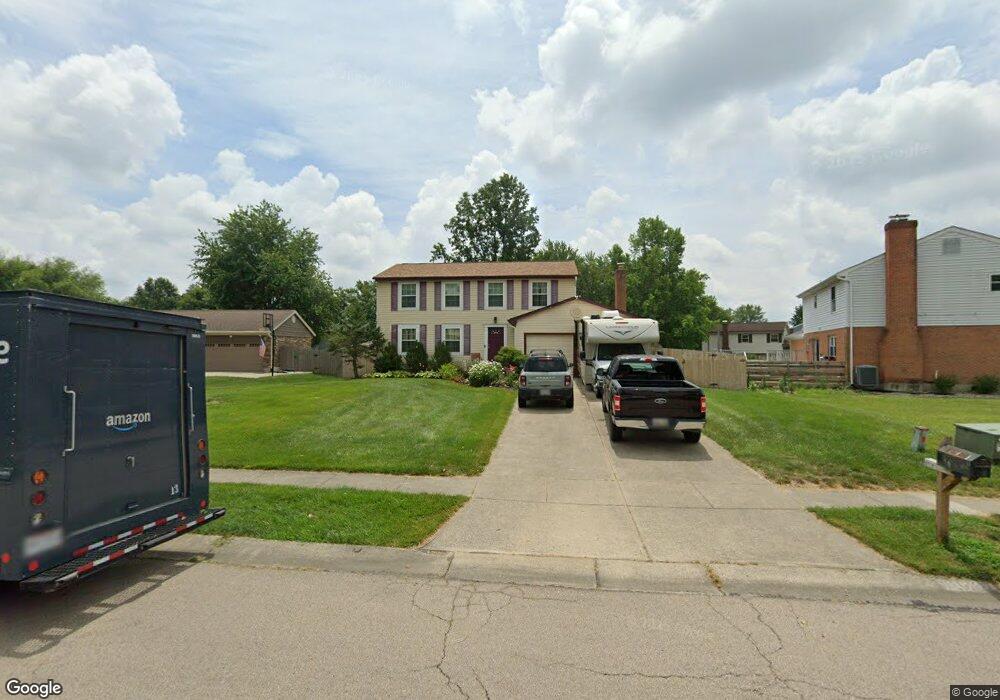
9646 Whippoorwill Ln Mason, OH 45040
Deerfield Township NeighborhoodEstimated Value: $344,000 - $457,000
4
Beds
3
Baths
2,016
Sq Ft
$204/Sq Ft
Est. Value
About This Home
This home is located at 9646 Whippoorwill Ln, Mason, OH 45040 and is currently estimated at $411,407, approximately $204 per square foot. 9646 Whippoorwill Ln is a home located in Warren County with nearby schools including Mason Intermediate Elementary School, Mason Middle School, and William Mason High School.
Ownership History
Date
Name
Owned For
Owner Type
Purchase Details
Closed on
Oct 25, 2004
Sold by
Dennison Denny C and Dennison Patricia E
Bought by
Siney Terrance and Siney Donna
Current Estimated Value
Home Financials for this Owner
Home Financials are based on the most recent Mortgage that was taken out on this home.
Original Mortgage
$161,500
Outstanding Balance
$80,755
Interest Rate
5.81%
Mortgage Type
Purchase Money Mortgage
Estimated Equity
$330,652
Purchase Details
Closed on
Oct 13, 1994
Sold by
Mcleon Lee R
Bought by
Dennison Denny C
Home Financials for this Owner
Home Financials are based on the most recent Mortgage that was taken out on this home.
Original Mortgage
$127,720
Interest Rate
8.55%
Mortgage Type
VA
Purchase Details
Closed on
Sep 25, 1987
Sold by
Appleby John E and Appleby Ellen
Bought by
Mcleod and Mcleod Lee R
Purchase Details
Closed on
Sep 24, 1981
Sold by
Floyd Floyd and Floyd Robert L
Purchase Details
Closed on
Aug 8, 1979
Sold by
Ryland Group & Inc
Purchase Details
Closed on
Jun 13, 1979
Sold by
Wynn Construction Co
Purchase Details
Closed on
Oct 17, 1978
Sold by
Wynn Construction Co
Create a Home Valuation Report for This Property
The Home Valuation Report is an in-depth analysis detailing your home's value as well as a comparison with similar homes in the area
Home Values in the Area
Average Home Value in this Area
Purchase History
| Date | Buyer | Sale Price | Title Company |
|---|---|---|---|
| Siney Terrance | $170,000 | Advanced Land Title Agency | |
| Dennison Denny C | $124,000 | -- | |
| Mcleod | $97,000 | -- | |
| -- | $88,000 | -- | |
| -- | $75,400 | -- | |
| -- | $14,000 | -- | |
| -- | -- | -- |
Source: Public Records
Mortgage History
| Date | Status | Borrower | Loan Amount |
|---|---|---|---|
| Open | Siney Terrance | $161,500 | |
| Previous Owner | Dennison Denny C | $127,720 |
Source: Public Records
Tax History Compared to Growth
Tax History
| Year | Tax Paid | Tax Assessment Tax Assessment Total Assessment is a certain percentage of the fair market value that is determined by local assessors to be the total taxable value of land and additions on the property. | Land | Improvement |
|---|---|---|---|---|
| 2024 | $4,284 | $109,520 | $31,500 | $78,020 |
| 2023 | $3,975 | $86,485 | $17,220 | $69,265 |
| 2022 | $3,975 | $86,485 | $17,220 | $69,265 |
| 2021 | $3,781 | $86,485 | $17,220 | $69,265 |
| 2020 | $4,025 | $70,312 | $14,000 | $56,312 |
| 2019 | $3,730 | $70,312 | $14,000 | $56,312 |
| 2018 | $3,713 | $70,312 | $14,000 | $56,312 |
| 2017 | $3,571 | $61,828 | $13,115 | $48,713 |
| 2016 | $3,670 | $61,828 | $13,115 | $48,713 |
| 2015 | $3,405 | $61,828 | $13,115 | $48,713 |
| 2014 | $3,405 | $53,300 | $11,310 | $41,990 |
| 2013 | $3,412 | $66,010 | $14,000 | $52,010 |
Source: Public Records
Map
Nearby Homes
- 9471 Whippoorwill Ln
- 9787 Snider Rd
- 9907 Kensington Ln
- 12100 Paulmeadows Dr
- 5625 Hunters Lake
- 9729 Old Stable Ct
- 7965 Timberbreak Dr
- 5686 Farm Field Dr
- 9609 Cedar Knoll Dr
- 12173 Crestfield Ct
- 12102 Paulmeadows Dr
- 12168 Crestfield Ct
- 11934 Snider Rd
- 12152 3rd Ave
- 12130 Crestfield Ct
- 7199 Fieldstone Ct
- 5434 Old Farm Dr
- 12109 4th Ave
- 12121 3rd Ave
- 8905 Suncrest Ln
- 9632 Whippoorwill Ln
- 9760 Bob White Place
- 9774 Bob White Place
- 9622 Whippoorwill Ln
- 9824 Sparrow Place
- 9788 Bob White Place
- 9641 Whippoorwill Ln
- 9655 Whippoorwill Ln
- 9610 Whippoorwill Ln
- 9761 Bob White Place
- 9627 Whippoorwill Ln
- 6170 Orchard Crossing
- 9669 Whippoorwill Ln
- 9800 Bob White Place
- 9611 Whippoorwill Ln
- 9781 Bob White Place
- 9600 Whippoorwill Ln
- 9681 Whippoorwill Ln
- 9823 Sparrow Place
- 6184 Orchard Crossing