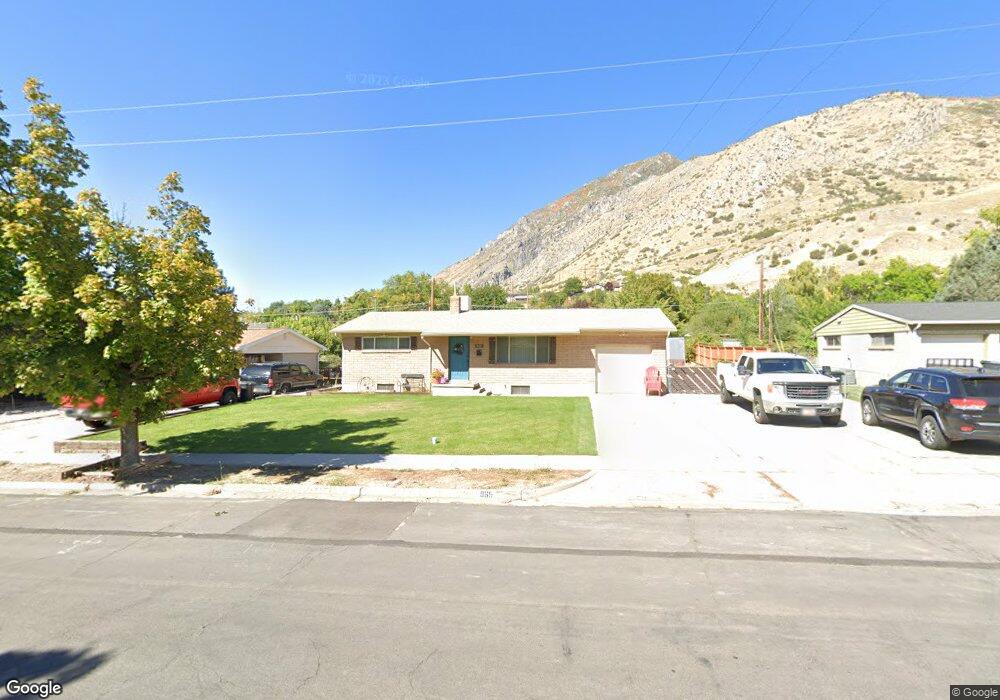
965 E 200 N Springville, UT 84663
Estimated Value: $470,000 - $517,000
3
Beds
2
Baths
2,243
Sq Ft
$218/Sq Ft
Est. Value
About This Home
This home is located at 965 E 200 N, Springville, UT 84663 and is currently estimated at $488,970, approximately $217 per square foot. 965 E 200 N is a home located in Utah County with nearby schools including Art City School, Springville Junior High School, and Springville High School.
Ownership History
Date
Name
Owned For
Owner Type
Purchase Details
Closed on
May 31, 2008
Sold by
Larue Waltina and Stanton Waltina Larue
Bought by
Larue Waltina
Current Estimated Value
Purchase Details
Closed on
Jan 31, 1997
Sold by
Stanton Waltina Larue and Dipaolo Alberico Bernardo
Bought by
Stanton Waltina Larue
Home Financials for this Owner
Home Financials are based on the most recent Mortgage that was taken out on this home.
Original Mortgage
$113,500
Outstanding Balance
$12,901
Interest Rate
7.62%
Estimated Equity
$476,069
Create a Home Valuation Report for This Property
The Home Valuation Report is an in-depth analysis detailing your home's value as well as a comparison with similar homes in the area
Home Values in the Area
Average Home Value in this Area
Purchase History
| Date | Buyer | Sale Price | Title Company |
|---|---|---|---|
| Larue Waltina | -- | First American Equity Loan | |
| Stanton Waltina Larue | -- | -- |
Source: Public Records
Mortgage History
| Date | Status | Borrower | Loan Amount |
|---|---|---|---|
| Open | Stanton Waltina Larue | $113,500 |
Source: Public Records
Tax History
| Year | Tax Paid | Tax Assessment Tax Assessment Total Assessment is a certain percentage of the fair market value that is determined by local assessors to be the total taxable value of land and additions on the property. | Land | Improvement |
|---|---|---|---|---|
| 2025 | $2,125 | $245,850 | -- | -- |
| 2024 | $2,125 | $217,745 | $0 | $0 |
| 2023 | $2,060 | $211,310 | $0 | $0 |
| 2022 | $2,306 | $232,265 | $0 | $0 |
| 2021 | $2,044 | $320,400 | $116,100 | $204,300 |
| 2020 | $1,845 | $280,400 | $86,000 | $194,400 |
| 2019 | $1,720 | $266,100 | $71,700 | $194,400 |
| 2018 | $1,597 | $235,700 | $66,700 | $169,000 |
| 2017 | $1,473 | $115,500 | $0 | $0 |
| 2016 | $1,328 | $102,080 | $0 | $0 |
| 2015 | $1,195 | $93,885 | $0 | $0 |
| 2014 | $1,133 | $88,440 | $0 | $0 |
Source: Public Records
Map
Nearby Homes
Your Personal Tour Guide
Ask me questions while you tour the home.