Estimated Value: $243,000 - $258,461
3
Beds
2
Baths
1,574
Sq Ft
$160/Sq Ft
Est. Value
About This Home
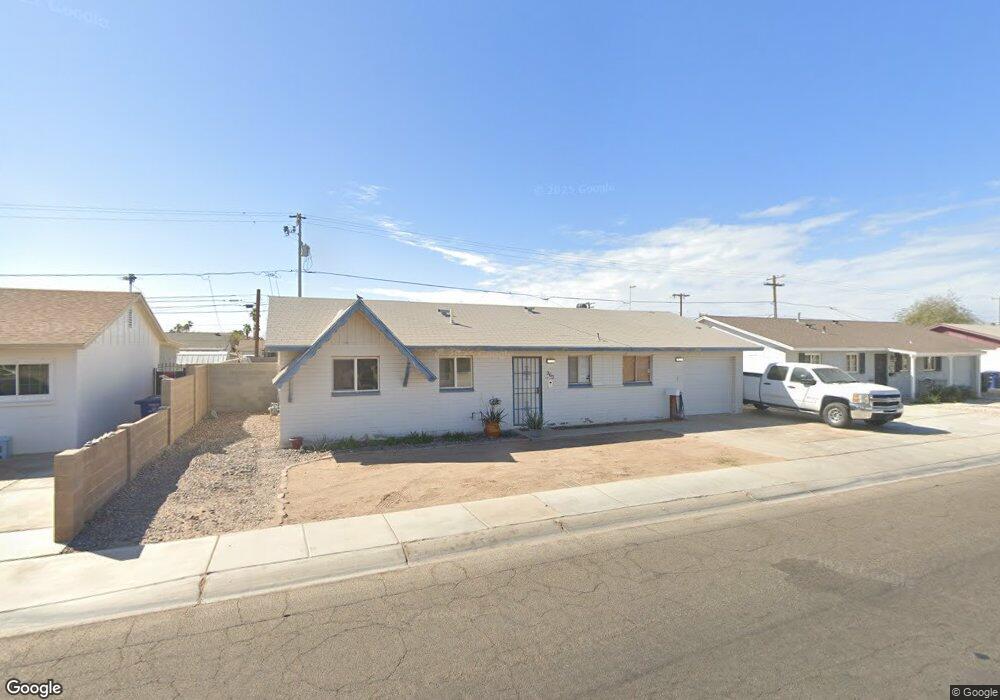
This home is located at 965 E 26th Place, Yuma, AZ 85365 and is currently estimated at $251,865, approximately $160 per square foot. 965 E 26th Place is a home located in Yuma County with nearby schools including C. W. McGraw Elementary School, Gila Vista Junior High School, and Kofa High School.
Ownership History
Date
Name
Owned For
Owner Type
Purchase Details
Closed on
Dec 1, 2009
Sold by
Secretary Of Housing & Urban Development
Bought by
Sackrider Jason
Current Estimated Value
Home Financials for this Owner
Home Financials are based on the most recent Mortgage that was taken out on this home.
Original Mortgage
$76,210
Outstanding Balance
$50,536
Interest Rate
4.99%
Mortgage Type
FHA
Estimated Equity
$201,329
Purchase Details
Closed on
Dec 20, 2008
Sold by
Taylor Bean & Whitaker Mortgage Corp
Bought by
Secretary Of Housing & Urban Development
Purchase Details
Closed on
Dec 11, 2008
Sold by
Maney Thomas E and Maney Maria J
Bought by
Taylor Bean & Whitaker Mortgage Corp
Purchase Details
Closed on
Mar 30, 2006
Sold by
Lebbie Tamba Maphinda and Lebbie Margaret G Maphinda
Bought by
Lebbie Tamba Maphinda and Lebbie Margaret G Maphinda
Create a Home Valuation Report for This Property
The Home Valuation Report is an in-depth analysis detailing your home's value as well as a comparison with similar homes in the area
Purchase History
| Date | Buyer | Sale Price | Title Company |
|---|---|---|---|
| Sackrider Jason | -- | Title Security | |
| Secretary Of Housing & Urban Development | -- | Chicago Title | |
| Taylor Bean & Whitaker Mortgage Corp | $206,171 | Chicago Title | |
| Lebbie Tamba Maphinda | -- | None Available |
Source: Public Records
Mortgage History
| Date | Status | Borrower | Loan Amount |
|---|---|---|---|
| Open | Sackrider Jason | $76,210 | |
| Previous Owner | Maney Thomas E | $190,311 |
Source: Public Records
Tax History
| Year | Tax Paid | Tax Assessment Tax Assessment Total Assessment is a certain percentage of the fair market value that is determined by local assessors to be the total taxable value of land and additions on the property. | Land | Improvement |
|---|---|---|---|---|
| 2025 | $1,835 | $17,054 | $3,550 | $13,504 |
| 2024 | $1,779 | $16,242 | $3,428 | $12,814 |
| 2023 | $1,779 | $15,469 | $3,197 | $12,272 |
| 2022 | $1,720 | $14,732 | $2,868 | $11,864 |
| 2021 | $1,819 | $14,030 | $2,357 | $11,673 |
| 2020 | $1,656 | $13,363 | $2,349 | $11,014 |
| 2019 | $1,628 | $12,726 | $2,675 | $10,051 |
| 2018 | $1,571 | $12,283 | $2,623 | $9,660 |
| 2017 | $1,507 | $12,283 | $2,623 | $9,660 |
| 2016 | $1,474 | $11,141 | $2,250 | $8,891 |
| 2015 | $1,315 | $10,769 | $1,463 | $9,306 |
| 2014 | $1,315 | $10,256 | $1,283 | $8,973 |
Source: Public Records
Map
Nearby Homes
- 2679 S James Ave
- 2632 S Beverly Ln
- 2330 E Test Listing !Dnp! Viaduct
- 613 E 26th St
- 683 E 25th St
- 529 E 26th St
- 563 E 25th St
- 927 E La Mesa St
- 2671 S Walnut Ave
- 2900 S Palo Verde Ln
- 2681 S Walnut Ave
- 1401 E Torrey Pines Cir
- 1420 E Sunset Ct
- 223 E 25th St
- 1426 E Pebble Beach Dr
- 1430 E Pebble Beach Dr Unit 3
- 2463 S Olivia Ave
- 1415 E Cypress St
- 362 E 30th St Unit 1
- 2488 S Barbara Ave
- 985 E 26th Place
- 1004 E Corona Dr
- 1014 E Corona Dr
- 1015 E 26th Place
- 925 E 26th Place
- 2656 S La Cruz Ave
- 960 E 26th Place
- 980 E 26th Place
- 940 E 26th Place
- 1024 E Corona Dr
- 1010 E 26th Place
- 1035 E 26th Place
- 920 E 26th Place
- 905 E 26th Place
- 2639 S James Ave
- 1034 E Corona Dr
- 2666 S La Cruz Ave
- 1030 E 26th Place
- 900 E 26th Place
- 905 E 26th St
Your Personal Tour Guide
Ask me questions while you tour the home.