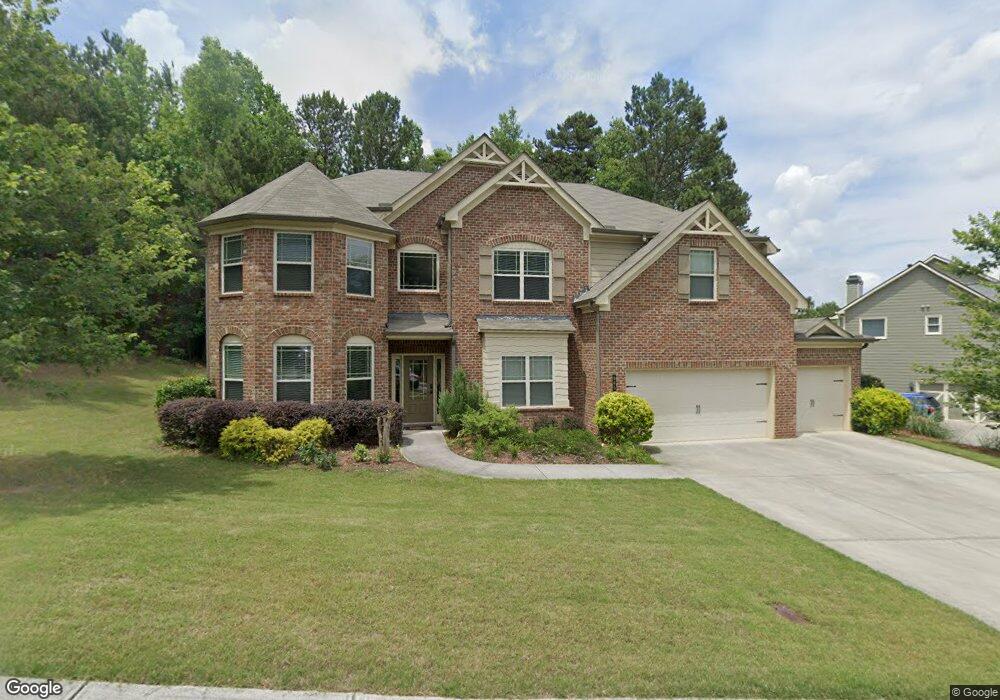
965 Grand Ivey Place Unit 1 Dacula, GA 30019
Estimated Value: $523,000 - $573,000
5
Beds
4
Baths
3,517
Sq Ft
$156/Sq Ft
Est. Value
About This Home
This home is located at 965 Grand Ivey Place Unit 1, Dacula, GA 30019 and is currently estimated at $548,209, approximately $155 per square foot. 965 Grand Ivey Place Unit 1 is a home located in Gwinnett County with nearby schools including Dyer Elementary School, Twin Rivers Middle School, and Mountain View High School.
Ownership History
Date
Name
Owned For
Owner Type
Purchase Details
Closed on
May 30, 2019
Sold by
Vanpham Truong Van
Bought by
Vanpham Truong Van and Pham Trung Huynh
Current Estimated Value
Home Financials for this Owner
Home Financials are based on the most recent Mortgage that was taken out on this home.
Original Mortgage
$268,000
Outstanding Balance
$234,656
Interest Rate
4.1%
Mortgage Type
New Conventional
Estimated Equity
$313,553
Purchase Details
Closed on
Jun 10, 2016
Sold by
Almont Homes Ne Inc
Bought by
Wymer Christopher C
Home Financials for this Owner
Home Financials are based on the most recent Mortgage that was taken out on this home.
Original Mortgage
$308,750
Interest Rate
3.57%
Mortgage Type
New Conventional
Purchase Details
Closed on
Jan 31, 2012
Sold by
Stein Georgia Holdings Llc
Bought by
Old Norcross Investments Inc
Purchase Details
Closed on
Dec 16, 2008
Sold by
Peachtree Fountain Llc
Bought by
Stein Ga Holdings Llc
Create a Home Valuation Report for This Property
The Home Valuation Report is an in-depth analysis detailing your home's value as well as a comparison with similar homes in the area
Home Values in the Area
Average Home Value in this Area
Purchase History
| Date | Buyer | Sale Price | Title Company |
|---|---|---|---|
| Vanpham Truong Van | -- | -- | |
| Vanpham Truong Van | $335,000 | -- | |
| Vanpham Truong Van | -- | -- | |
| Vanpham Truong Van | $335,000 | -- | |
| Wymer Christopher C | $325,000 | -- | |
| Almont Homes Ne Inc | $50,000 | -- | |
| Wymer Christopher C | $325,000 | -- | |
| Almont Homes Ne Inc | $50,000 | -- | |
| Old Norcross Investments Inc | $185,000 | -- | |
| Old Norcross Investments Inc | $185,000 | -- | |
| Stein Ga Holdings Llc | $1,482,000 | -- | |
| Stein Ga Holdings Llc | $1,482,000 | -- |
Source: Public Records
Mortgage History
| Date | Status | Borrower | Loan Amount |
|---|---|---|---|
| Open | Vanpham Truong Van | $268,000 | |
| Closed | Vanpham Truong Van | $268,000 | |
| Previous Owner | Almont Homes Ne Inc | $308,750 |
Source: Public Records
Tax History Compared to Growth
Tax History
| Year | Tax Paid | Tax Assessment Tax Assessment Total Assessment is a certain percentage of the fair market value that is determined by local assessors to be the total taxable value of land and additions on the property. | Land | Improvement |
|---|---|---|---|---|
| 2025 | $8,512 | $231,040 | $32,000 | $199,040 |
| 2024 | $7,710 | $206,000 | $32,000 | $174,000 |
| 2023 | $7,710 | $206,000 | $32,000 | $174,000 |
| 2022 | $7,173 | $191,640 | $32,000 | $159,640 |
| 2021 | $5,203 | $134,000 | $24,000 | $110,000 |
| 2020 | $5,234 | $134,000 | $24,000 | $110,000 |
| 2019 | $4,705 | $137,160 | $24,000 | $113,160 |
| 2018 | $4,565 | $130,000 | $24,000 | $106,000 |
| 2016 | $708 | $12,000 | $12,000 | $0 |
| 2015 | $480 | $12,000 | $12,000 | $0 |
| 2014 | -- | $12,000 | $12,000 | $0 |
Source: Public Records
Map
Nearby Homes
- 978 Grand Ivey Place NE
- 2001 Lavender Ct
- 1954 Acorn Ln
- 869 Nichols Landing Ln
- 1001 Autumn Glen Ct
- 2964 Old Peachtree Rd
- 971 Reap Ln
- 1305 Fontainebleau Ct NE
- 2422 Oak Bluff Dr
- 2467 Bittersweet Cir
- 704 Valley Glen Dr
- 898 Harvest Brook Dr
- 2933 Misty Rock Cove
- Colburn Plan at Pinecrest Ridge
- Canterbury Plan at Pinecrest Ridge
- Turnbridge Plan at Pinecrest Ridge
- Camelot Plan at Pinecrest Ridge
- Brooke UHP Plan at Pinecrest Ridge
- Noah Plan at Pinecrest Ridge
- Noble Plan at Pinecrest Ridge
- 965 Grand Ivey Place
- 955 Grand Ivey Place
- 945 Grand Ivey Place
- 968 Grand Ivey Place
- 978 Grand Ivey Place Unit 230
- 978 Grand Ivey Place
- 958 Grand Ivey Place
- 935 Grand Ivey Place
- 2072 Ash Rose Dr
- 2160 Indian Ivey Ln
- 925 Grand Ivey Place
- 2150 Indian Ivey Ln
- 2077 Ash Rose Dr Unit L220
- 2077 Ash Rose Dr
- 0 Ash Rose Dr Unit 8620002
- 0 Ash Rose Dr Unit 8842474
- 2062 Ash Rose Dr
- 2062 Ash Rose Dr Unit 226
- 2698 Old Peachtree Rd
- 2140 Indian Ivey Ln