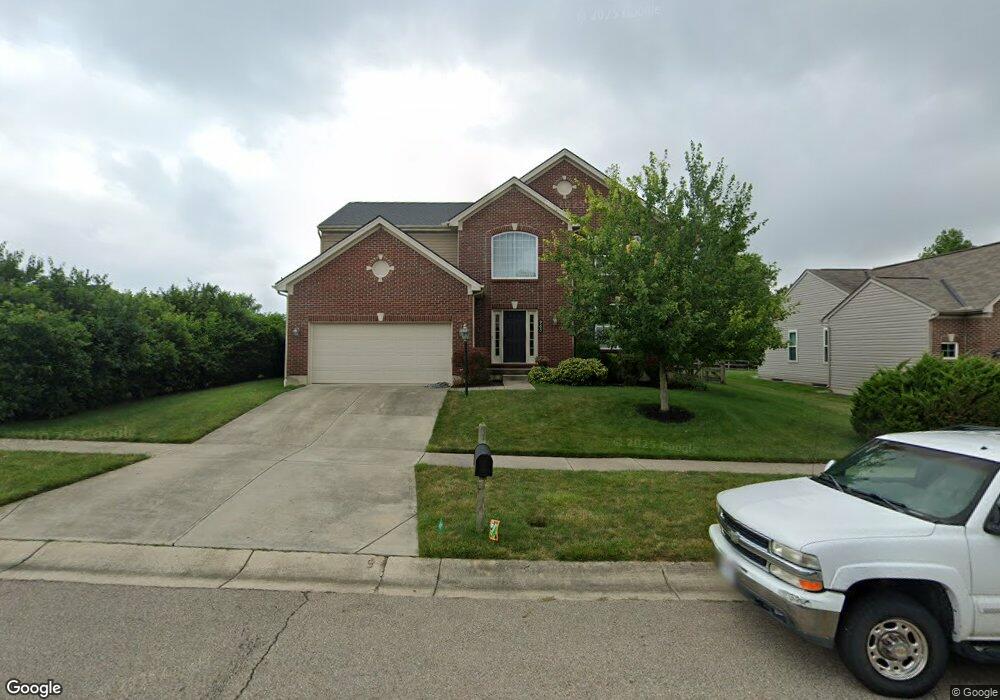
965 Spruce Glen Morrow, OH 45152
Hamilton Township NeighborhoodEstimated Value: $343,000 - $389,000
4
Beds
3
Baths
1,985
Sq Ft
$187/Sq Ft
Est. Value
About This Home
This home is located at 965 Spruce Glen, Morrow, OH 45152 and is currently estimated at $371,842, approximately $187 per square foot. 965 Spruce Glen is a home located in Warren County with nearby schools including Little Miami High School.
Ownership History
Date
Name
Owned For
Owner Type
Purchase Details
Closed on
Mar 29, 2022
Sold by
Frisby Joshua D and Frisby Sarah
Bought by
Wagner Marsha L
Current Estimated Value
Home Financials for this Owner
Home Financials are based on the most recent Mortgage that was taken out on this home.
Original Mortgage
$200,976
Outstanding Balance
$187,630
Interest Rate
3.69%
Mortgage Type
New Conventional
Estimated Equity
$184,212
Purchase Details
Closed on
Nov 20, 2009
Sold by
Inverness Group Incorporated
Bought by
Frisby Joshua D
Home Financials for this Owner
Home Financials are based on the most recent Mortgage that was taken out on this home.
Original Mortgage
$191,280
Interest Rate
5.02%
Mortgage Type
New Conventional
Purchase Details
Closed on
Aug 12, 2009
Sold by
G & G Land Group Llc
Bought by
Inverness Group Incorporated
Home Financials for this Owner
Home Financials are based on the most recent Mortgage that was taken out on this home.
Original Mortgage
$20,000,000
Interest Rate
5.21%
Mortgage Type
Purchase Money Mortgage
Purchase Details
Closed on
Feb 23, 2009
Sold by
The Ryland Group Inc
Bought by
G & G Land Group Llc
Purchase Details
Closed on
Sep 28, 2004
Sold by
Towne Development Group Ltd
Bought by
Ryland Group Inc
Create a Home Valuation Report for This Property
The Home Valuation Report is an in-depth analysis detailing your home's value as well as a comparison with similar homes in the area
Home Values in the Area
Average Home Value in this Area
Purchase History
| Date | Buyer | Sale Price | Title Company |
|---|---|---|---|
| Wagner Marsha L | $251,220 | Revelson Paul R | |
| Frisby Joshua D | $187,533 | Sterling Title & Assoc Llc | |
| Inverness Group Incorporated | $10,000 | Sterling Land Title Agency I | |
| G & G Land Group Llc | $1,166 | Sterling Title | |
| Ryland Group Inc | $229,966 | -- |
Source: Public Records
Mortgage History
| Date | Status | Borrower | Loan Amount |
|---|---|---|---|
| Open | Wagner Marsha L | $200,976 | |
| Previous Owner | Frisby Joshua D | $191,280 | |
| Previous Owner | Inverness Group Incorporated | $20,000,000 |
Source: Public Records
Tax History Compared to Growth
Tax History
| Year | Tax Paid | Tax Assessment Tax Assessment Total Assessment is a certain percentage of the fair market value that is determined by local assessors to be the total taxable value of land and additions on the property. | Land | Improvement |
|---|---|---|---|---|
| 2024 | $4,774 | $107,680 | $28,000 | $79,680 |
| 2023 | $4,148 | $83,492 | $12,915 | $70,577 |
| 2022 | $4,101 | $83,493 | $12,915 | $70,578 |
| 2021 | $3,909 | $83,493 | $12,915 | $70,578 |
| 2020 | $3,722 | $67,879 | $10,500 | $57,379 |
| 2019 | $3,785 | $67,879 | $10,500 | $57,379 |
| 2018 | $3,221 | $67,879 | $10,500 | $57,379 |
| 2017 | $2,506 | $54,835 | $9,177 | $45,658 |
| 2016 | $2,567 | $54,835 | $9,177 | $45,658 |
| 2015 | $2,565 | $54,835 | $9,177 | $45,658 |
| 2014 | $2,893 | $54,830 | $9,180 | $45,660 |
| 2013 | $2,846 | $62,740 | $10,500 | $52,240 |
Source: Public Records
Map
Nearby Homes
- 6203 Silver Wood Dr
- 6244 Avebury Ct
- 6250 Avebury Ct
- 792 Oak Forest Dr
- 668 Thornton Dr
- 5708 Cochran Rd
- 619 Crabapple Ct
- 6556 Thistle Grove
- 678 Emerald Dr
- 6610 Waverly Park
- 5481 Windsor Ct
- 809 Emerald Dr
- 5672 Wyntree Ct
- 3 Heath Ct
- 721 Kingly Terrace
- 5079 Ross Ridge
- 6527 Abingdon Hall
- 5079 Ross Ridge Rd
- 920 Pondside Ln
- 6583 West Rd
- 959 Spruce Glen
- 6244 Silver Wood Dr
- 953 Spruce Glen
- 6232 Silver Wood Dr
- 968 Spruce Glen
- 976 Spruce Glen
- 960 Spruce Glen
- 947 Spruce Glen
- 6239 Silver Wood Dr
- 923 Birch Grove
- 6220 Silver Wood Dr
- 984 Spruce Glen
- 952 Spruce Glen
- 926 Birch Grove
- 997 Spruce Glen
- 6227 Silver Wood Dr
- 964 Spruce Glen
- 992 Spruce Glen
- 941 Spruce Glen
- 880 Thornton Dr