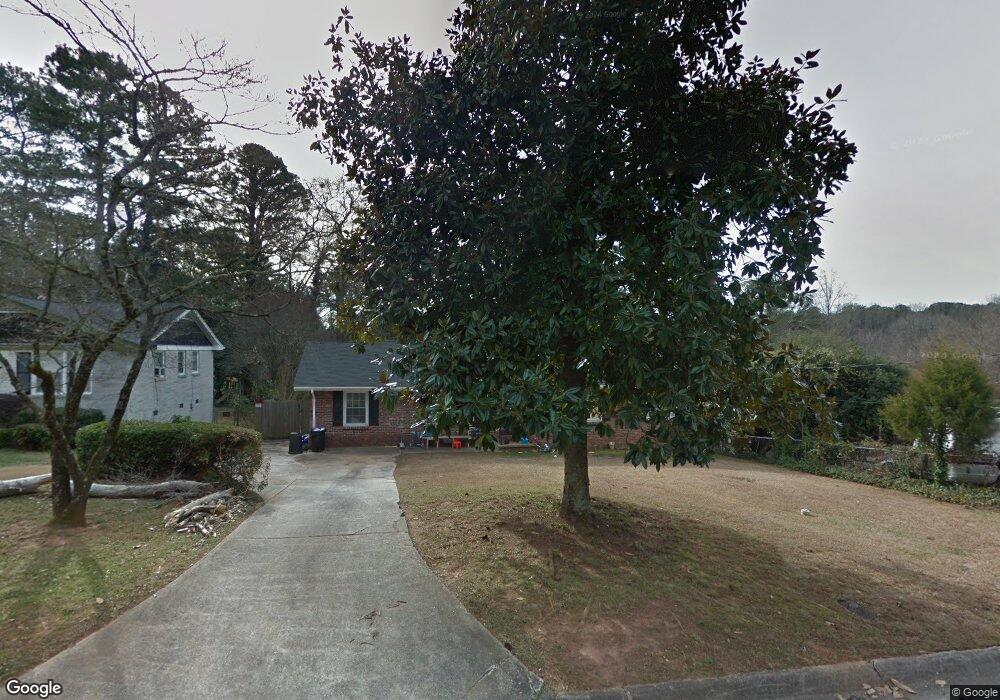
965 Texel Ln Clarkston, GA 30021
Estimated Value: $263,000 - $336,000
3
Beds
2
Baths
1,656
Sq Ft
$181/Sq Ft
Est. Value
About This Home
This home is located at 965 Texel Ln, Clarkston, GA 30021 and is currently estimated at $300,217, approximately $181 per square foot. 965 Texel Ln is a home located in DeKalb County with nearby schools including Jolly Elementary School, Freedom Middle School, and Clarkston High School.
Ownership History
Date
Name
Owned For
Owner Type
Purchase Details
Closed on
Jun 6, 2019
Sold by
Pmc Sfr Holding Llc
Bought by
Pmc South Borrower Llc
Current Estimated Value
Purchase Details
Closed on
Mar 31, 2017
Sold by
Pretium Mortgage Trust
Bought by
Pretium Sfr Holding Llc
Purchase Details
Closed on
Oct 4, 2016
Sold by
Stacey
Bought by
Wilmington Savings Fund Societ
Purchase Details
Closed on
Jul 15, 2008
Sold by
Yerger Joey A
Bought by
Millarker Stacey and Millarker Jennifer
Home Financials for this Owner
Home Financials are based on the most recent Mortgage that was taken out on this home.
Original Mortgage
$164,003
Interest Rate
6.43%
Mortgage Type
FHA
Purchase Details
Closed on
Dec 6, 1999
Sold by
Kosty Michele M
Bought by
Yerger Joey A
Home Financials for this Owner
Home Financials are based on the most recent Mortgage that was taken out on this home.
Original Mortgage
$96,030
Interest Rate
7.85%
Mortgage Type
New Conventional
Create a Home Valuation Report for This Property
The Home Valuation Report is an in-depth analysis detailing your home's value as well as a comparison with similar homes in the area
Home Values in the Area
Average Home Value in this Area
Purchase History
| Date | Buyer | Sale Price | Title Company |
|---|---|---|---|
| Pmc South Borrower Llc | -- | -- | |
| Pretium Sfr Holding Llc | $118,400 | -- | |
| Wilmington Savings Fund Societ | $125,000 | -- | |
| Millarker Stacey | $166,300 | -- | |
| Yerger Joey A | $99,000 | -- |
Source: Public Records
Mortgage History
| Date | Status | Borrower | Loan Amount |
|---|---|---|---|
| Previous Owner | Millarker Stacey | $164,003 | |
| Previous Owner | Yerger Joey A | $96,030 |
Source: Public Records
Tax History Compared to Growth
Tax History
| Year | Tax Paid | Tax Assessment Tax Assessment Total Assessment is a certain percentage of the fair market value that is determined by local assessors to be the total taxable value of land and additions on the property. | Land | Improvement |
|---|---|---|---|---|
| 2025 | $5,249 | $109,760 | $30,733 | $79,027 |
| 2024 | $5,477 | $115,000 | $32,000 | $83,000 |
| 2023 | $5,477 | $126,000 | $32,000 | $94,000 |
| 2022 | $3,884 | $80,680 | $20,000 | $60,680 |
| 2021 | $3,027 | $61,160 | $20,000 | $41,160 |
| 2020 | $2,901 | $58,280 | $9,640 | $48,640 |
| 2019 | $2,692 | $53,520 | $9,640 | $43,880 |
| 2018 | $2,026 | $47,360 | $8,440 | $38,920 |
| 2017 | $2,556 | $50,200 | $9,640 | $40,560 |
| 2016 | $1,578 | $47,360 | $9,640 | $37,720 |
| 2014 | $1,098 | $33,440 | $9,640 | $23,800 |
Source: Public Records
Map
Nearby Homes
- 957 Texel Ln Unit 4
- 3819 Cottage Cir
- 911 E Green Ln
- 3846 Cottage Cir
- 3852 Cottage Cir
- 856 Dunleith Ct
- 1172 Denison Dr
- 907 E Green Ln
- 749 Dunleith Ct
- 4027 Stoneview Cir
- 4066 Bontura Ct Unit 3
- 1186 Vaughan St
- 4201 Church St
- 868 Maxey Hill Ct
- 6765 Baynes Hill Dr
- 1111 Gunnison Ct Unit 4
- 3813 Church St
- 3647 Cobble Mill Ln Unit Ste B4
- 1297 Tree Creek Ct
- 6625 Old Singleton Ln
- 971 Texel Ln Unit 4
- 0 Texel Ln Unit 7039028
- 0 Texel Ln Unit 7160369
- 977 Texel Ln
- 962 Texel Ln
- 962 Texel Ln Unit 1
- 968 Texel Ln Unit 4
- 3930 Norman Rd
- 983 Texel Ln
- 954 Texel Ln
- 974 Texel Ln
- 1008 Nielsen Dr
- 996 Nielsen Dr
- 980 Texel Ln Unit 4
- 989 Texel Ln
- 1014 Nielsen Dr
- 1014 Nielsen Dr Unit 4
- 1029 Nielsen Dr
- 986 Texel Ln
- 988 Belle Glade Dr