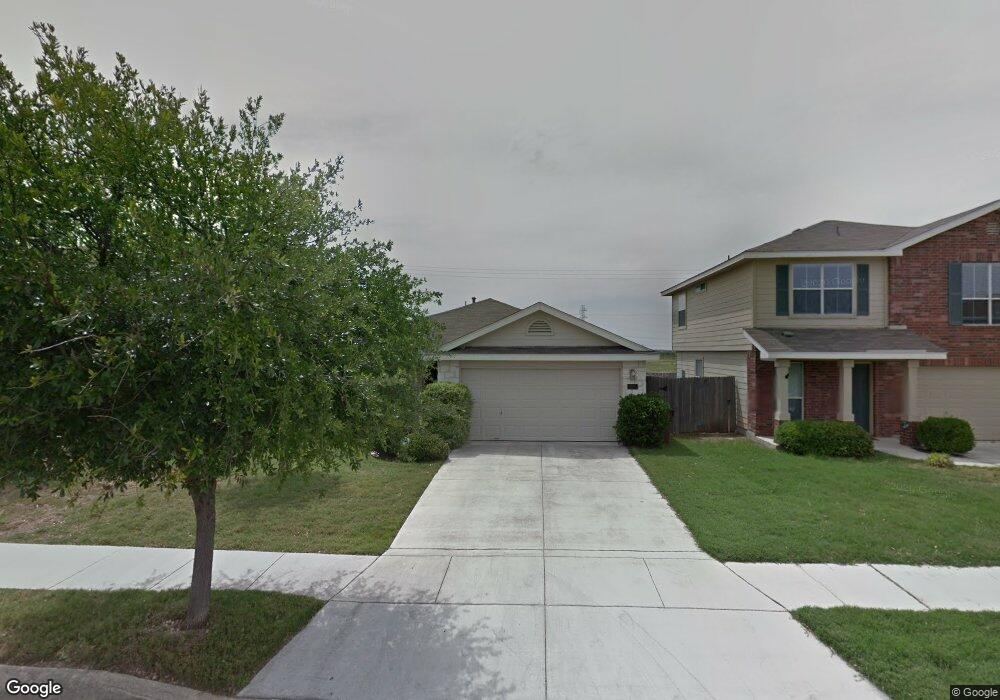
9650 Palomino Path San Antonio, TX 78254
Estimated Value: $251,660 - $282,000
3
Beds
2
Baths
1,577
Sq Ft
$170/Sq Ft
Est. Value
About This Home
This home is located at 9650 Palomino Path, San Antonio, TX 78254 and is currently estimated at $268,415, approximately $170 per square foot. 9650 Palomino Path is a home located in Bexar County with nearby schools including Krueger Elementary School, Jefferson Middle School, and School of Science and Technology Hill Country.
Ownership History
Date
Name
Owned For
Owner Type
Purchase Details
Closed on
Mar 24, 2016
Sold by
Pina Omar and Pina Omar Alejandro
Bought by
Steitle Jason E
Current Estimated Value
Home Financials for this Owner
Home Financials are based on the most recent Mortgage that was taken out on this home.
Original Mortgage
$136,800
Outstanding Balance
$108,277
Interest Rate
3.65%
Mortgage Type
New Conventional
Estimated Equity
$160,138
Purchase Details
Closed on
Mar 28, 2005
Sold by
Continental Homes Of Texas Lp
Bought by
Pina Omar Alejandro
Home Financials for this Owner
Home Financials are based on the most recent Mortgage that was taken out on this home.
Original Mortgage
$101,292
Interest Rate
5.71%
Mortgage Type
Purchase Money Mortgage
Create a Home Valuation Report for This Property
The Home Valuation Report is an in-depth analysis detailing your home's value as well as a comparison with similar homes in the area
Home Values in the Area
Average Home Value in this Area
Purchase History
| Date | Buyer | Sale Price | Title Company |
|---|---|---|---|
| Steitle Jason E | -- | First American Title | |
| Pina Omar Alejandro | -- | -- |
Source: Public Records
Mortgage History
| Date | Status | Borrower | Loan Amount |
|---|---|---|---|
| Open | Steitle Jason E | $136,800 | |
| Previous Owner | Pina Omar Alejandro | $101,292 | |
| Closed | Pina Omar Alejandro | $25,323 |
Source: Public Records
Tax History Compared to Growth
Tax History
| Year | Tax Paid | Tax Assessment Tax Assessment Total Assessment is a certain percentage of the fair market value that is determined by local assessors to be the total taxable value of land and additions on the property. | Land | Improvement |
|---|---|---|---|---|
| 2025 | $5,024 | $268,380 | $49,630 | $218,750 |
| 2024 | $5,024 | $271,140 | $49,630 | $221,510 |
| 2023 | $5,024 | $270,000 | $49,630 | $220,370 |
| 2022 | $4,834 | $238,000 | $41,360 | $196,640 |
| 2021 | $4,211 | $200,000 | $37,640 | $162,360 |
| 2020 | $3,763 | $175,000 | $37,640 | $137,360 |
| 2019 | $3,930 | $177,000 | $32,520 | $144,480 |
| 2018 | $3,759 | $169,140 | $32,520 | $136,620 |
| 2017 | $3,655 | $164,120 | $32,520 | $131,600 |
| 2016 | $3,553 | $159,560 | $32,520 | $127,040 |
| 2015 | $2,998 | $151,890 | $32,520 | $119,370 |
| 2014 | $2,998 | $143,010 | $0 | $0 |
Source: Public Records
Map
Nearby Homes
- 10511 Marengo Ln
- 10627 Arabian Sands
- 9427 Velvet Spring
- 10707 Arabian Sands
- 9607 Country Shadow
- 9807 Sandlet Trail
- 9510 Caspian Forest
- 10814 Mustang Oak Dr
- 9726 Palomino Oaks
- 9407 Pegasus Run Rd
- 10703 Spirit Roam
- 9214 Herman Hollow
- 9950 Sandlet Trail
- 9951 Sandlet Trail
- 9218 Mare Country
- 9714 Connemara Bend
- 9011 Mustang Pass
- 9103 Mare Trace
- 10322 Filly Valley
- 9050 Herman Hollow
- 9654 Palomino Path
- 9646 Palomino Path
- 9642 Palomino Path
- 9658 Palomino Path
- 9638 Palomino Path
- 10614 Tiger Horse Dr
- 9634 Palomino Path Unit 14
- 9639 Palomino Path
- 10622 Tiger Horse Dr
- 9662 Palomino Path
- 10603 Tiger Horse Dr
- 9630 Palomino Path
- 10626 Tiger Horse Dr
- 9635 Palomino Path
- 10611 Tiger Horse Dr
- 9626 Palomino Path
- 9631 Palomino Path
- 10630 Tiger Horse Dr
- 10615 Tiger Horse Dr
- 10607 Tiger Horse Dr