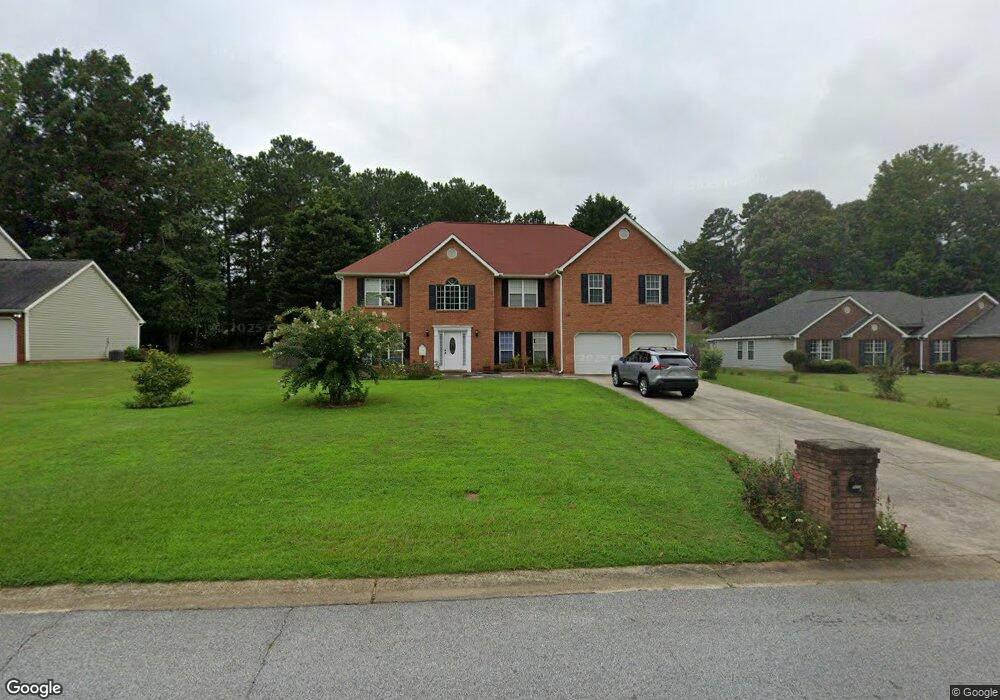
9651 Winding Way Ln Jonesboro, GA 30238
Estimated Value: $345,402 - $386,000
4
Beds
3
Baths
3,213
Sq Ft
$116/Sq Ft
Est. Value
About This Home
This home is located at 9651 Winding Way Ln, Jonesboro, GA 30238 and is currently estimated at $373,351, approximately $116 per square foot. 9651 Winding Way Ln is a home located in Clayton County with nearby schools including Kemp Primary School, Kemp Elementary School, and Mundys Mill Middle School.
Ownership History
Date
Name
Owned For
Owner Type
Purchase Details
Closed on
Oct 22, 2024
Sold by
Sour Thyda
Bought by
Kim Sovann Trust and Sovann Kanha
Current Estimated Value
Purchase Details
Closed on
May 21, 2009
Sold by
Sour Thyda
Bought by
Sour Thyda and Sovann Kanha
Home Financials for this Owner
Home Financials are based on the most recent Mortgage that was taken out on this home.
Original Mortgage
$85,000
Interest Rate
4.81%
Mortgage Type
New Conventional
Purchase Details
Closed on
Dec 2, 2008
Sold by
Citimortgage Inc
Bought by
Veterans Admn
Purchase Details
Closed on
Dec 18, 1997
Sold by
First Dimension Homes
Bought by
Smith Francis and Smith Karyn
Home Financials for this Owner
Home Financials are based on the most recent Mortgage that was taken out on this home.
Original Mortgage
$160,191
Interest Rate
7.2%
Mortgage Type
VA
Create a Home Valuation Report for This Property
The Home Valuation Report is an in-depth analysis detailing your home's value as well as a comparison with similar homes in the area
Home Values in the Area
Average Home Value in this Area
Purchase History
| Date | Buyer | Sale Price | Title Company |
|---|---|---|---|
| Kim Sovann Trust | -- | -- | |
| Sour Thyda | -- | -- | |
| Sour Thyda | -- | -- | |
| Veterans Admn | -- | -- | |
| Citimortgage Inc | $118,094 | -- | |
| Smith Francis | $157,100 | -- |
Source: Public Records
Mortgage History
| Date | Status | Borrower | Loan Amount |
|---|---|---|---|
| Previous Owner | Sour Thyda | $85,000 | |
| Previous Owner | Smith Francis | $160,191 |
Source: Public Records
Tax History Compared to Growth
Tax History
| Year | Tax Paid | Tax Assessment Tax Assessment Total Assessment is a certain percentage of the fair market value that is determined by local assessors to be the total taxable value of land and additions on the property. | Land | Improvement |
|---|---|---|---|---|
| 2024 | $2,264 | $124,680 | $8,800 | $115,880 |
| 2023 | $4,662 | $129,120 | $8,800 | $120,320 |
| 2022 | $2,133 | $118,840 | $8,800 | $110,040 |
| 2021 | $1,591 | $89,680 | $8,800 | $80,880 |
| 2020 | $1,453 | $80,780 | $8,800 | $71,980 |
| 2019 | $1,323 | $72,412 | $7,600 | $64,812 |
| 2018 | $1,224 | $67,589 | $7,600 | $59,989 |
| 2017 | $1,240 | $65,643 | $7,600 | $58,043 |
| 2016 | $1,098 | $59,090 | $7,600 | $51,490 |
| 2015 | $916 | $0 | $0 | $0 |
| 2014 | $818 | $49,260 | $7,600 | $41,660 |
Source: Public Records
Map
Nearby Homes
- 9620 Carolina Dr
- 9744 Carolina Dr
- 9531 Winding Way Ln
- 1131 Orr Rd
- 1352 Riverstone Rd Unit 104
- 1364 Riverstone Rd Unit 99
- 1366 Riverstone Rd Unit 98
- 1362 Riverstone Rd Unit LOT 100
- 1366 Riverstone Rd
- 1360 Riverstone Rd Unit LOT 101
- 1352 Riverstone Rd
- 1239 Riverstone Rd
- 1262 Riverstone Rd
- 1234 Riverstone Rd
- 1250 Riverstone Rd
- 1256 Riverstone Rd
- 1274 Riverstone Rd
- 6632 Chason Woods Ct
- 9639 Winding Way Ln Unit 3
- 9661 Winding Way Ln Unit 3
- 9652 Carolina Dr
- 9652 Carolina Dr Unit 13
- 9629 Winding Way Ln Unit 3
- 9671 Winding Way Ln Unit 3
- 9662 Carolina Dr
- 9640 Carolina Dr Unit 2
- 0 Winding Way Ln Unit 7473755
- 0 Winding Way Ln Unit 7261904
- 0 Winding Way Ln Unit 7006957
- 0 Winding Way Ln Unit 3174605
- 0 Winding Way Ln Unit 8785894
- 0 Winding Way Ln Unit 8484124
- 0 Winding Way Ln Unit 8174112
- 0 Winding Way Ln Unit 3088695
- 9650 Winding Way Ln Unit 4
- 9672 Carolina Dr
- 9670 Winding Way Ln Unit 4
- 9683 Winding Way Ln