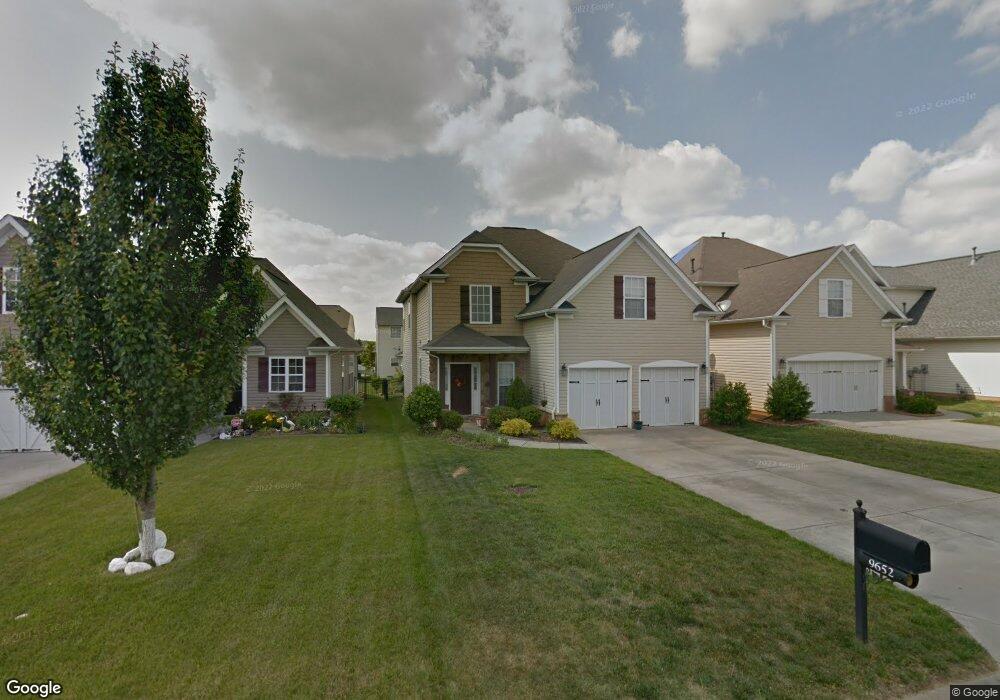
9652 Marquette St NW Concord, NC 28027
Estimated Value: $411,000 - $474,000
3
Beds
3
Baths
2,253
Sq Ft
$193/Sq Ft
Est. Value
About This Home
This home is located at 9652 Marquette St NW, Concord, NC 28027 and is currently estimated at $435,527, approximately $193 per square foot. 9652 Marquette St NW is a home located in Cabarrus County with nearby schools including W.R. Odell Elementary School, Harris Road Middle, and Cox Mill High School.
Ownership History
Date
Name
Owned For
Owner Type
Purchase Details
Closed on
Jul 22, 2011
Sold by
U S Bank National Association
Bought by
Nalbone Dwight M and Nalbone Alycia F
Current Estimated Value
Home Financials for this Owner
Home Financials are based on the most recent Mortgage that was taken out on this home.
Original Mortgage
$139,650
Outstanding Balance
$96,166
Interest Rate
4.53%
Mortgage Type
New Conventional
Estimated Equity
$339,361
Purchase Details
Closed on
May 14, 2010
Sold by
Jimenez Bibiana and Olguin Mauricio
Bought by
Us Bank National Association
Purchase Details
Closed on
Dec 29, 2006
Sold by
North Carolina Partners Inc
Bought by
Olguin Mauricio and Jimenez Bibiana
Home Financials for this Owner
Home Financials are based on the most recent Mortgage that was taken out on this home.
Original Mortgage
$217,550
Interest Rate
7.65%
Mortgage Type
Purchase Money Mortgage
Create a Home Valuation Report for This Property
The Home Valuation Report is an in-depth analysis detailing your home's value as well as a comparison with similar homes in the area
Home Values in the Area
Average Home Value in this Area
Purchase History
| Date | Buyer | Sale Price | Title Company |
|---|---|---|---|
| Nalbone Dwight M | $147,000 | None Available | |
| Us Bank National Association | $138,985 | None Available | |
| Olguin Mauricio | $230,500 | None Available |
Source: Public Records
Mortgage History
| Date | Status | Borrower | Loan Amount |
|---|---|---|---|
| Open | Nalbone Dwight M | $139,650 | |
| Previous Owner | Olguin Mauricio | $217,550 |
Source: Public Records
Tax History Compared to Growth
Tax History
| Year | Tax Paid | Tax Assessment Tax Assessment Total Assessment is a certain percentage of the fair market value that is determined by local assessors to be the total taxable value of land and additions on the property. | Land | Improvement |
|---|---|---|---|---|
| 2025 | $3,966 | $398,240 | $82,000 | $316,240 |
| 2024 | $3,966 | $398,240 | $82,000 | $316,240 |
| 2023 | $3,068 | $251,460 | $49,000 | $202,460 |
| 2022 | $3,068 | $251,460 | $49,000 | $202,460 |
| 2021 | $3,068 | $251,460 | $49,000 | $202,460 |
| 2020 | $3,068 | $251,460 | $49,000 | $202,460 |
| 2019 | $2,398 | $196,580 | $35,000 | $161,580 |
| 2018 | $2,359 | $196,580 | $35,000 | $161,580 |
| 2017 | $2,320 | $196,580 | $35,000 | $161,580 |
| 2016 | $1,376 | $188,920 | $35,000 | $153,920 |
| 2015 | $2,229 | $188,920 | $35,000 | $153,920 |
| 2014 | $2,229 | $188,920 | $35,000 | $153,920 |
Source: Public Records
Map
Nearby Homes
- 9611 Marquette St NW
- 9711 Marquette St NW
- 1484 Haverford Rd NW
- 1423 Napa St NW
- 1498 Burrell Ave NW
- 1418 Skidaway St NW Unit 427
- 9593 Valencia Ave NW
- 9803 Walkers Glen Dr NW
- 9768 Walkers Glen Dr NW
- 1266 Amber Ridge Rd NW
- 9691 Moss Plantation Ave NW
- 9720 Walkers Glen Dr NW
- 9610 Walkers Glen Dr NW
- 9608 Indian Beech Ave NW
- 1559 Broderick St NW
- 9562 Indian Beech Ave NW Unit 291
- 1576 Bay Meadows Ave NW
- 9430 Pepperidge Ave NW
- 1595 Bay Meadows Ave NW
- 9618 Teamwork St NW
- 9648 Marquette St NW
- 9656 Marquette St NW
- 9644 Marquette St NW Unit 811
- 9660 Marquette St NW
- 9649 Evanston St NW
- 9645 Evanston St NW
- 9653 Evanston St NW
- 9640 Marquette St NW
- 9668 Marquette St NW
- 9641 Evanston St NW
- 9657 Evanston St NW
- 9653 Marquette St NW
- 9636 Marquette St NW
- 9649 Marquette St NW
- 9657 Marquette St NW
- 9645 Marquette St NW
- 9637 Evanston St NW
- 9672 Marquette St NW
- 9661 Marquette St NW
- 9661 Evanston St NW