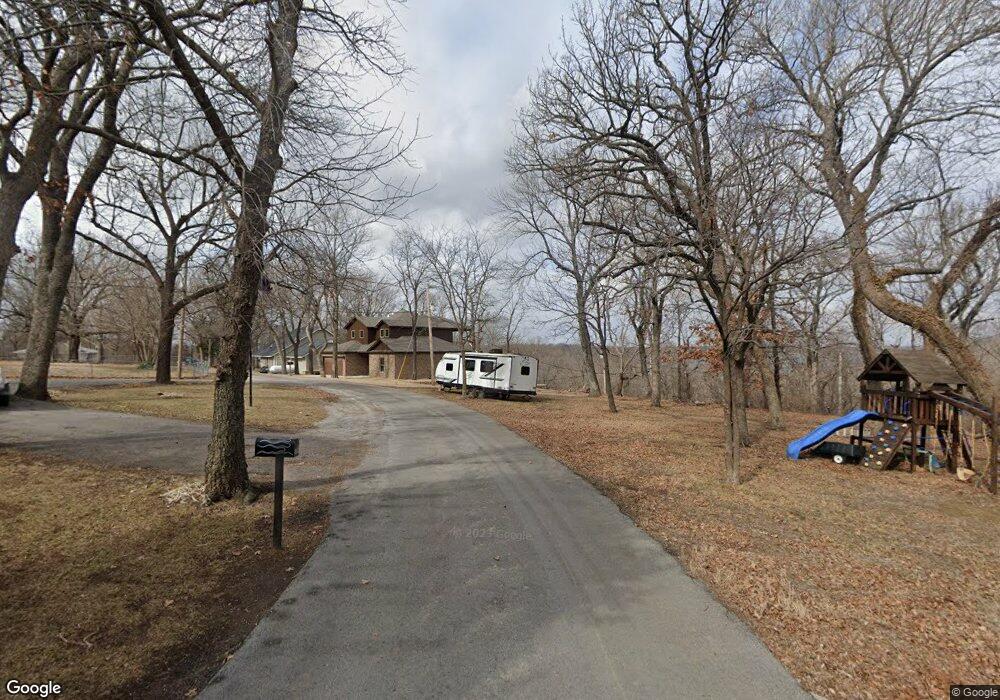
9653 E Redbud St Claremore, OK 74017
Estimated Value: $163,000 - $217,000
2
Beds
2
Baths
1,337
Sq Ft
$139/Sq Ft
Est. Value
About This Home
This home is located at 9653 E Redbud St, Claremore, OK 74017 and is currently estimated at $186,394, approximately $139 per square foot. 9653 E Redbud St is a home located in Rogers County with nearby schools including Sequoyah Elementary School and Sequoyah High School.
Ownership History
Date
Name
Owned For
Owner Type
Purchase Details
Closed on
Nov 10, 2022
Sold by
Clare Justin A
Bought by
Sinni William B and Sinni Elizabeth A
Current Estimated Value
Home Financials for this Owner
Home Financials are based on the most recent Mortgage that was taken out on this home.
Original Mortgage
$122,316
Outstanding Balance
$118,129
Interest Rate
6.92%
Mortgage Type
FHA
Estimated Equity
$68,265
Purchase Details
Closed on
Sep 10, 2008
Sold by
Fisher Sherryl Ann
Bought by
Clare Justin A
Home Financials for this Owner
Home Financials are based on the most recent Mortgage that was taken out on this home.
Original Mortgage
$107,041
Interest Rate
6.57%
Mortgage Type
FHA
Purchase Details
Closed on
Jun 30, 2006
Sold by
Greife John Charles
Bought by
Fisher Sherryl Ann
Create a Home Valuation Report for This Property
The Home Valuation Report is an in-depth analysis detailing your home's value as well as a comparison with similar homes in the area
Purchase History
| Date | Buyer | Sale Price | Title Company |
|---|---|---|---|
| Sinni William B | $125,000 | -- | |
| Clare Justin A | $105,000 | None Available | |
| Fisher Sherryl Ann | -- | None Available |
Source: Public Records
Mortgage History
| Date | Status | Borrower | Loan Amount |
|---|---|---|---|
| Open | Sinni William B | $122,316 | |
| Previous Owner | Clare Justin A | $107,041 |
Source: Public Records
Tax History
| Year | Tax Paid | Tax Assessment Tax Assessment Total Assessment is a certain percentage of the fair market value that is determined by local assessors to be the total taxable value of land and additions on the property. | Land | Improvement |
|---|---|---|---|---|
| 2025 | $1,404 | $14,587 | $3,047 | $11,540 |
| 2024 | $1,365 | $14,162 | $2,694 | $11,468 |
| 2023 | $1,365 | $13,750 | $2,475 | $11,275 |
| 2022 | $1,220 | $12,439 | $2,475 | $9,964 |
| 2021 | $1,264 | $13,284 | $2,475 | $10,809 |
| 2020 | $1,284 | $13,080 | $2,475 | $10,605 |
| 2019 | $1,228 | $12,710 | $2,475 | $10,235 |
| 2018 | $1,258 | $13,180 | $2,475 | $10,705 |
| 2017 | $1,190 | $12,498 | $2,475 | $10,023 |
| 2016 | $1,160 | $12,134 | $2,475 | $9,659 |
| 2015 | $1,121 | $11,781 | $2,475 | $9,306 |
| 2014 | $1,098 | $11,438 | $2,475 | $8,963 |
Source: Public Records
Map
Nearby Homes
- 13122 S Redbud St
- 13196 S Walnut Rd
- 11802 S Hickory St
- 13266 S Spruce Ln
- 13525 S Grande Pointe Pkwy
- 9885 E Mesa Dr
- 0 E 420 Rd Unit 2604502
- 0 E 420 Rd Unit 2604695
- 0003 S 4110 Rd
- 0005 S 4110 Rd
- 11225 S Oologah Cir
- 11252 S 4110 Rd
- 15750 S Old Highway 88
- 000 HWY 88
- 7 E 420
- 9462 E Yorkshire Ave
- 7425 E Oologah Place
- 213 E Sunday Ave
- 15201 S 4100 Rd
- 0 S 4130 Rd
- 12803 S Ash St
- 12805 S Ash St
- 0 Redbud St Unit 926100
- 0 Redbud St Unit 902420
- 0 Redbud St Unit 2110796
- 9600 E Dogwood St
- 9610 E Dogwood St
- 12804 S Ash St
- 12806 S Ash St
- 9611 E Redbud St
- 13125 S Ash St
- 13122 S Ash St
- 9592 E Dogwood St
- 22115 E Dogwood St
- 9696 E Redbud St
- 13121 S Redbud St
- 0 E Dogwood St
- 21204 E Redbud St
- 13133 S Redbud St
- 13102 S Redbud St
Your Personal Tour Guide
Ask me questions while you tour the home.