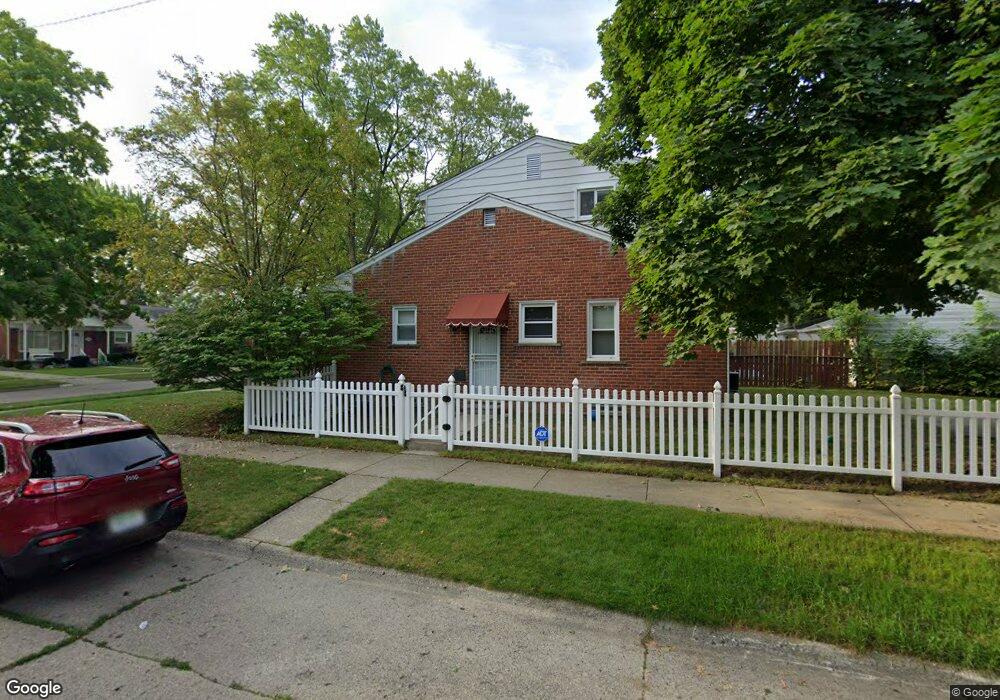
9655 Dixie Unit Bldg-Unit Redford, MI 48239
Estimated Value: $215,253 - $236,000
Studio
2
Baths
1,503
Sq Ft
$150/Sq Ft
Est. Value
About This Home
This home is located at 9655 Dixie Unit Bldg-Unit, Redford, MI 48239 and is currently estimated at $226,063, approximately $150 per square foot. 9655 Dixie Unit Bldg-Unit is a home located in Wayne County with nearby schools including John D. Pierce Middle School, Lee M. Thurston High School, and Washington-Parks Academy.
Ownership History
Date
Name
Owned For
Owner Type
Purchase Details
Closed on
Sep 13, 2022
Sold by
Irvine Lori
Bought by
Irvine Lori
Current Estimated Value
Purchase Details
Closed on
Jun 22, 2018
Sold by
The Robbya R Green Weir Trust
Bought by
Irvine Lori
Purchase Details
Closed on
Jul 20, 2009
Sold by
Green Weir Robbya R and Weir Robbya R
Bought by
Green Weir Robbya R and Robbya R Green Weir Trust
Purchase Details
Closed on
Oct 31, 2006
Sold by
Green Weir Robbya and Weir Robbya R
Bought by
Green Weir Robbya
Home Financials for this Owner
Home Financials are based on the most recent Mortgage that was taken out on this home.
Original Mortgage
$136,850
Interest Rate
6.36%
Mortgage Type
Purchase Money Mortgage
Purchase Details
Closed on
Jul 23, 1996
Sold by
Robby R Weir
Bought by
Butala Richard P and Butala Dana D
Create a Home Valuation Report for This Property
The Home Valuation Report is an in-depth analysis detailing your home's value as well as a comparison with similar homes in the area
Home Values in the Area
Average Home Value in this Area
Purchase History
| Date | Buyer | Sale Price | Title Company |
|---|---|---|---|
| Irvine Lori | -- | -- | |
| Irvine Lori | $162,000 | None Available | |
| Irvine Lori | $162,000 | None Available | |
| Green Weir Robbya R | -- | None Available | |
| Green Weir Robbya | -- | None Available | |
| Butala Richard P | $97,900 | -- |
Source: Public Records
Mortgage History
| Date | Status | Borrower | Loan Amount |
|---|---|---|---|
| Previous Owner | Green Weir Robbya | $136,850 |
Source: Public Records
Tax History
| Year | Tax Paid | Tax Assessment Tax Assessment Total Assessment is a certain percentage of the fair market value that is determined by local assessors to be the total taxable value of land and additions on the property. | Land | Improvement |
|---|---|---|---|---|
| 2025 | $1,357 | $98,400 | $0 | $0 |
| 2024 | $1,320 | $91,600 | $0 | $0 |
| 2023 | $1,264 | $79,200 | $0 | $0 |
| 2022 | $3,554 | $67,300 | $0 | $0 |
| 2021 | $3,420 | $63,300 | $0 | $0 |
| 2020 | $3,372 | $57,700 | $0 | $0 |
| 2019 | $3,297 | $49,700 | $0 | $0 |
| 2018 | $708 | $40,200 | $0 | $0 |
| 2017 | $2,449 | $37,300 | $0 | $0 |
| 2016 | $1,909 | $38,700 | $0 | $0 |
| 2015 | $2,973 | $35,600 | $0 | $0 |
| 2013 | $2,880 | $30,000 | $0 | $0 |
| 2012 | $2,085 | $32,800 | $6,700 | $26,100 |
Source: Public Records
Map
Nearby Homes