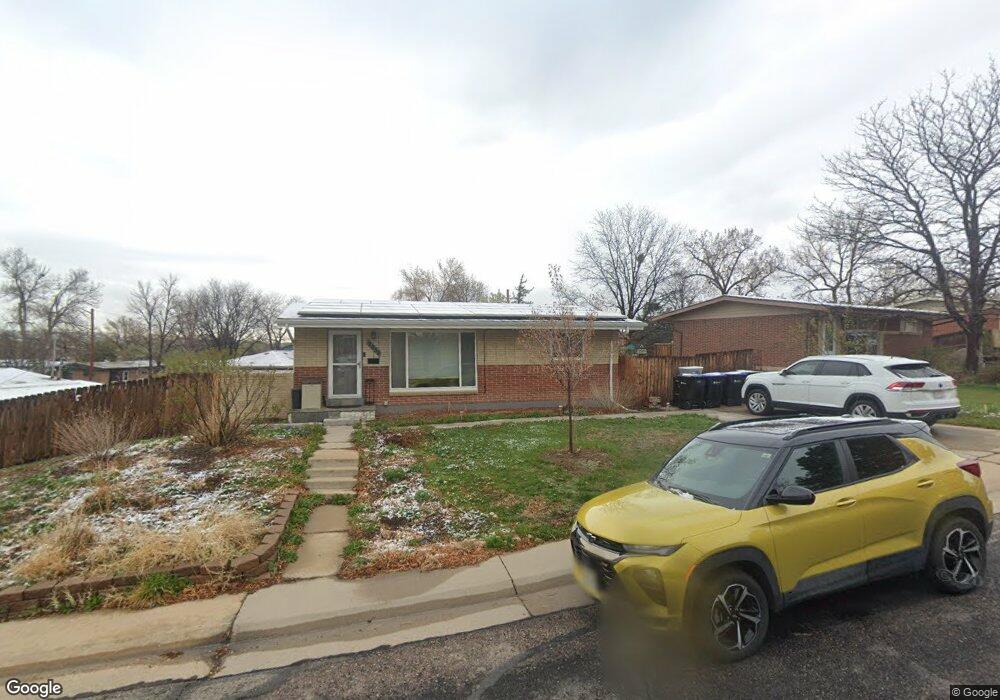
9655 W 56th Place Arvada, CO 80002
Arvada Plaza Area NeighborhoodEstimated Value: $509,000 - $574,000
4
Beds
2
Baths
1,900
Sq Ft
$291/Sq Ft
Est. Value
About This Home
This home is located at 9655 W 56th Place, Arvada, CO 80002 and is currently estimated at $552,595, approximately $290 per square foot. 9655 W 56th Place is a home located in Jefferson County with nearby schools including Lawrence Elementary School, Arvada K-8, and Arvada High School.
Ownership History
Date
Name
Owned For
Owner Type
Purchase Details
Closed on
Jun 21, 2018
Sold by
Fuqua Michael Ryon and Fuqua Rebecca K
Bought by
Quave David Christopher and Johnson Abigale Jane
Current Estimated Value
Home Financials for this Owner
Home Financials are based on the most recent Mortgage that was taken out on this home.
Original Mortgage
$305,200
Outstanding Balance
$263,947
Interest Rate
4.5%
Mortgage Type
New Conventional
Estimated Equity
$288,648
Purchase Details
Closed on
Sep 25, 2009
Sold by
Brown Carmen L
Bought by
Fuqua Michael Ryon and Fuqua Rebecca K
Home Financials for this Owner
Home Financials are based on the most recent Mortgage that was taken out on this home.
Original Mortgage
$159,948
Interest Rate
5.36%
Mortgage Type
FHA
Purchase Details
Closed on
Jan 23, 2009
Sold by
Brown Mark A
Bought by
Brown Carmen L
Create a Home Valuation Report for This Property
The Home Valuation Report is an in-depth analysis detailing your home's value as well as a comparison with similar homes in the area
Home Values in the Area
Average Home Value in this Area
Purchase History
| Date | Buyer | Sale Price | Title Company |
|---|---|---|---|
| Quave David Christopher | $381,500 | None Available | |
| Fuqua Michael Ryon | $162,900 | Htco | |
| Brown Carmen L | -- | None Available |
Source: Public Records
Mortgage History
| Date | Status | Borrower | Loan Amount |
|---|---|---|---|
| Open | Quave David Christopher | $305,200 | |
| Previous Owner | Fuqua Michael Ryon | $159,948 |
Source: Public Records
Tax History Compared to Growth
Tax History
| Year | Tax Paid | Tax Assessment Tax Assessment Total Assessment is a certain percentage of the fair market value that is determined by local assessors to be the total taxable value of land and additions on the property. | Land | Improvement |
|---|---|---|---|---|
| 2024 | $3,168 | $32,658 | $18,336 | $14,322 |
| 2023 | $3,168 | $32,658 | $18,336 | $14,322 |
| 2022 | $2,495 | $25,476 | $10,964 | $14,512 |
| 2021 | $2,536 | $26,208 | $11,279 | $14,929 |
| 2020 | $2,355 | $24,404 | $10,573 | $13,831 |
| 2019 | $2,323 | $24,404 | $10,573 | $13,831 |
| 2018 | $1,862 | $19,012 | $5,924 | $13,088 |
| 2017 | $1,704 | $19,012 | $5,924 | $13,088 |
| 2016 | $1,500 | $15,768 | $5,539 | $10,229 |
| 2015 | $1,356 | $15,768 | $5,539 | $10,229 |
| 2014 | $1,356 | $13,397 | $4,872 | $8,525 |
Source: Public Records
Map
Nearby Homes
- 9678 W 56th Place
- 9570 Grandview Ave
- Residence One Plan at Ralston Creek
- Residence Two Plan at Ralston Creek
- 9546 W 58th Ave Unit B
- 5370 Johnson St
- 5406 Iris St
- 9350 Grandview Ave
- 9487 W 58th Ave Unit B
- 9457 W 58th Ave Unit D
- 9457 W 58th Ave Unit B
- 5362 Lynn Dr
- 5500 Holland Dr
- 5336 Johnson St
- 10331 W 59th Ave
- 10211 W 59th Place
- 9100 Grandview Ave
- 5490 Garland St
- 10239 W 55th Dr Unit 3
- 5520 Garrison St
- 9649 W 56th Place
- 9716 W 57th Ave
- 9710 W 57th Ave
- 9643 W 56th Place
- 9672 W 56th Place
- 9634 W 57th Ave
- 9666 W 56th Place
- 9722 W 57th Ave
- 9637 W 56th Place
- 9704 W 57th Ave
- 9660 W 56th Place
- 9721 W 57th Ave
- 9715 W 57th Ave
- 9727 W 57th Ave
- 9654 W 56th Place
- 9628 W 57th Ave
- 9709 W 57th Ave
- 9731 W 57th Ave
- 5634 Jellison St
- 9631 W 56th Place