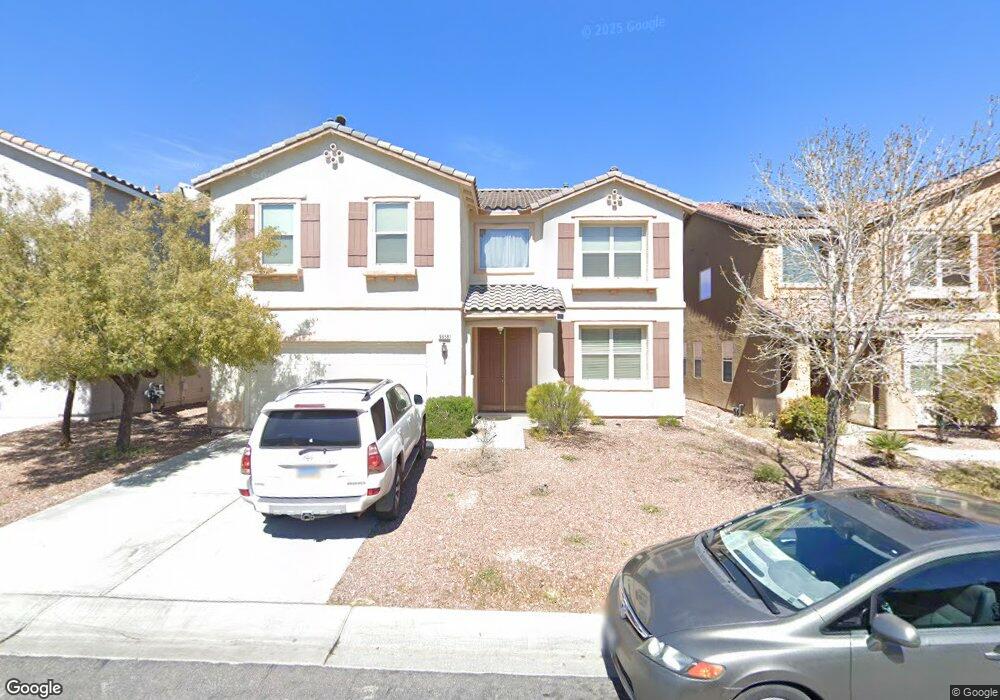
9658 Hawk Cliff Ave Las Vegas, NV 89148
Estimated Value: $542,000 - $585,000
4
Beds
3
Baths
2,494
Sq Ft
$226/Sq Ft
Est. Value
About This Home
This home is located at 9658 Hawk Cliff Ave, Las Vegas, NV 89148 and is currently estimated at $564,494, approximately $226 per square foot. 9658 Hawk Cliff Ave is a home located in Clark County with nearby schools including Shelley Berkley Elementary School, Wilbur & Theresa Faiss Middle School, and Sierra Vista High School.
Ownership History
Date
Name
Owned For
Owner Type
Purchase Details
Closed on
Mar 4, 2022
Sold by
Rouhani Vanessa G
Bought by
Rouhani Parissa
Current Estimated Value
Purchase Details
Closed on
Sep 24, 2011
Sold by
Fortuno Deanna F and Fortuno Reynaldo G
Bought by
Rouhani George and Rouhani Vanessa G
Home Financials for this Owner
Home Financials are based on the most recent Mortgage that was taken out on this home.
Original Mortgage
$111,100
Interest Rate
3.5%
Mortgage Type
FHA
Purchase Details
Closed on
Nov 14, 2003
Sold by
Beazer Homes Holdings Corp
Bought by
Fortuno Reynaldo G and Fortuno Deanna F
Home Financials for this Owner
Home Financials are based on the most recent Mortgage that was taken out on this home.
Original Mortgage
$216,400
Interest Rate
5.89%
Mortgage Type
Unknown
Create a Home Valuation Report for This Property
The Home Valuation Report is an in-depth analysis detailing your home's value as well as a comparison with similar homes in the area
Home Values in the Area
Average Home Value in this Area
Purchase History
| Date | Buyer | Sale Price | Title Company |
|---|---|---|---|
| Rouhani Parissa | -- | Accommodation/Courtesy Recordi | |
| Rouhani George | $170,000 | Ticor Title Las Vegas | |
| Fortuno Reynaldo G | $240,485 | Lawyers Title Of Nevada |
Source: Public Records
Mortgage History
| Date | Status | Borrower | Loan Amount |
|---|---|---|---|
| Previous Owner | Rouhani George | $111,100 | |
| Previous Owner | Fortuno Reynaldo G | $216,400 |
Source: Public Records
Tax History Compared to Growth
Tax History
| Year | Tax Paid | Tax Assessment Tax Assessment Total Assessment is a certain percentage of the fair market value that is determined by local assessors to be the total taxable value of land and additions on the property. | Land | Improvement |
|---|---|---|---|---|
| 2025 | $2,332 | $146,008 | $49,700 | $96,308 |
| 2024 | $2,265 | $146,008 | $49,700 | $96,308 |
| 2023 | $1,827 | $137,339 | $46,550 | $90,789 |
| 2022 | $2,305 | $119,579 | $36,750 | $82,829 |
| 2021 | $2,135 | $111,267 | $32,550 | $78,717 |
| 2020 | $2,070 | $108,772 | $30,800 | $77,972 |
| 2019 | $2,045 | $104,576 | $28,000 | $76,576 |
| 2018 | $1,951 | $96,390 | $23,100 | $73,290 |
| 2017 | $2,575 | $87,799 | $21,000 | $66,799 |
| 2016 | $1,827 | $81,464 | $19,250 | $62,214 |
| 2015 | $1,823 | $86,227 | $13,300 | $72,927 |
| 2014 | $1,766 | $58,418 | $9,800 | $48,618 |
Source: Public Records
Map
Nearby Homes
- 9709 Hawk Cliff Ave
- 9628 Scrub Jay Ct
- 6169 Novelty St
- 6336 Fence Post St
- 6067 Doroca St
- 6125 Powdermill St
- 9505 Delivery Ave
- 6234 Burrell Ct
- 9611 Aberdeen Ridge Ct
- 9632 Abbey Pond Ave
- 9691 Loud Water Way
- 9580 Magnificent Ave
- 9564 Fresh Crown Ct
- 9680 Waukegan Ave
- 5915 Poplar Tree St Unit 7
- 10056 Cranbrook Falls Ct
- 10015 Wonderful Day Dr Unit 8
- 9460 Magnificent Ave
- 6228 Windfresh Dr Unit 2
- 10023 Liberty View Rd Unit 8
- 9664 Hawk Cliff Ave
- 9650 Hawk Cliff Ave
- 9674 Hawk Cliff Ave
- 9674 Hawk Cliff Ave
- 9642 Hawk Cliff Ave
- 9682 Hawk Cliff Ave
- 9634 Hawk Cliff Ave
- 9659 Hawk Cliff Ave
- 9651 Hawk Cliff Ave
- 9667 Hawk Cliff Ave
- 9643 Hawk Cliff Ave
- 9675 Hawk Cliff Ave
- 9626 Hawk Cliff Ave
- 9635 Hawk Cliff Ave
- 9690 Hawk Cliff Ave
- 9683 Hawk Cliff Ave
- 9627 Hawk Cliff Ave
- 9696 Hawk Cliff Ave
- 9652 Grouse Grove Ave
- 9660 Grouse Grove Ave