9659 Harrison Ave Harrison, OH 45030
Studio
--
Bath
--
Sq Ft
274,733
Sq Ft Lot
About This Home
This home is located at 9659 Harrison Ave, Harrison, OH 45030. 9659 Harrison Ave is a home located in Hamilton County with nearby schools including William Henry Harrison High School, Mt. Healthy Preparatory And Fitness Academy, and St. John The Baptist School.
Ownership History
Date
Name
Owned For
Owner Type
Purchase Details
Closed on
Apr 12, 2011
Sold by
Cornelius Joel
Bought by
Cornelius Limited Liability Company
Purchase Details
Closed on
Oct 30, 2007
Sold by
Losekamp Daniel J and Losekamp Linda L
Bought by
Cornelius Llc
Home Financials for this Owner
Home Financials are based on the most recent Mortgage that was taken out on this home.
Original Mortgage
$270,000
Interest Rate
6.33%
Mortgage Type
Commercial
Purchase Details
Closed on
Oct 10, 2006
Sold by
Losekamp Daniel J and Losekamp Linda L
Bought by
Losekamp Daniel J and Losekamp Linda L
Purchase Details
Closed on
Sep 13, 2002
Sold by
Merchants Bank & Trust Co
Bought by
Losekamp Daniel J and Losekamp Linda L
Home Financials for this Owner
Home Financials are based on the most recent Mortgage that was taken out on this home.
Original Mortgage
$200,000
Interest Rate
6.4%
Mortgage Type
Seller Take Back
Create a Home Valuation Report for This Property
The Home Valuation Report is an in-depth analysis detailing your home's value as well as a comparison with similar homes in the area
Purchase History
| Date | Buyer | Sale Price | Title Company |
|---|---|---|---|
| Cornelius Limited Liability Company | -- | Attorney | |
| Cornelius Llc | $270,000 | Attorney | |
| Losekamp Daniel J | -- | Attorney | |
| Losekamp Daniel J | $200,000 | -- | |
| Merchants Bank & Trust Co | -- | -- |
Source: Public Records
Mortgage History
| Date | Status | Borrower | Loan Amount |
|---|---|---|---|
| Closed | Cornelius Llc | $270,000 | |
| Previous Owner | Losekamp Daniel J | $200,000 |
Source: Public Records
Tax History
| Year | Tax Paid | Tax Assessment Tax Assessment Total Assessment is a certain percentage of the fair market value that is determined by local assessors to be the total taxable value of land and additions on the property. | Land | Improvement |
|---|---|---|---|---|
| 2025 | $13,253 | $240,569 | $73,948 | $166,621 |
| 2023 | $12,706 | $240,569 | $73,948 | $166,621 |
| 2022 | $13,201 | $224,473 | $83,563 | $140,910 |
| 2021 | $13,326 | $224,473 | $83,563 | $140,910 |
| 2020 | $13,284 | $224,473 | $83,563 | $140,910 |
| 2019 | $12,502 | $198,646 | $73,948 | $124,698 |
| 2018 | $12,548 | $198,646 | $73,948 | $124,698 |
| 2017 | $12,025 | $198,646 | $73,948 | $124,698 |
| 2016 | $10,638 | $187,254 | $69,510 | $117,744 |
| 2015 | $10,635 | $187,254 | $69,510 | $117,744 |
| 2014 | $10,620 | $187,254 | $69,510 | $117,744 |
| 2013 | $11,089 | $199,206 | $73,948 | $125,258 |
Source: Public Records
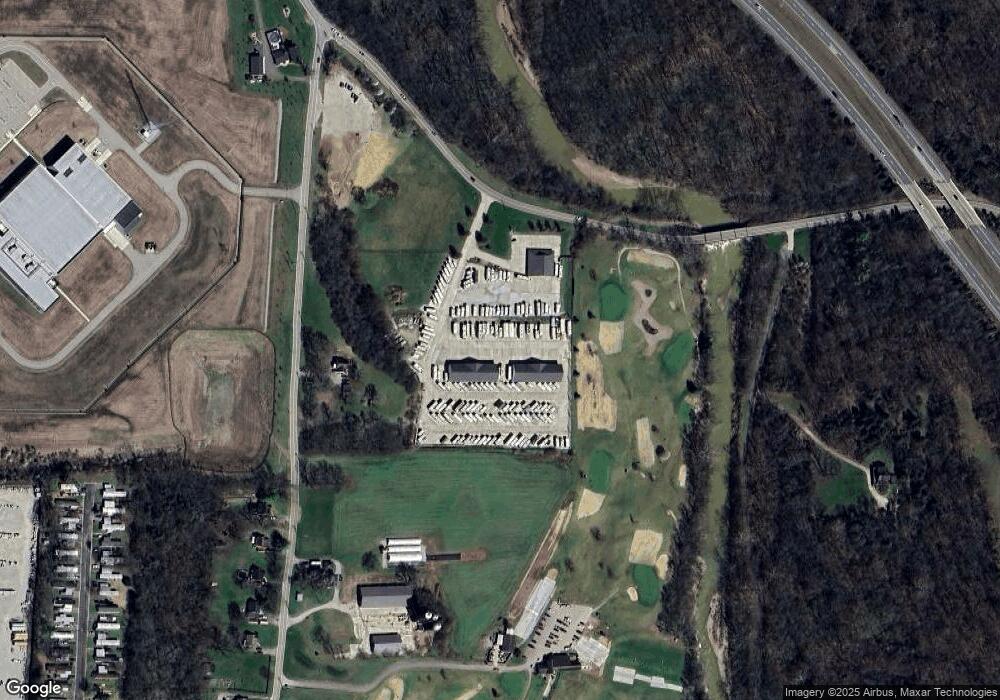
Map
Nearby Homes
- 9210 Harrison Ave
- 125 Hopping Ct
- 10701 Campbell Rd
- 10502 West Rd
- 8881 Harrison Ave
- 120 Hickory Flats Dr
- 119 Mackie Ln
- 8821 Bluejay View Dr
- 8828 Harrison Pike
- 10740 Stone Ridge Way
- 130 Country View Dr
- 449 Lyness Ave
- 7167 Redridge Dr
- 7139 Redridge Dr
- 10803 Stone Ridge Way Unit 15
- 398 Legacy Way
- 483 Heritage Square
- 0 New Haven Rd Unit 1867315
- 5839 Konga Dr
- 0 Carolina Trace Rd Unit 1840792
- 8510 Dry Fork Rd
- 6001 Dry Fork Rd
- 5535 Dry Fork Rd
- 8326 Dry Fork Rd
- 8389 Dry Fork Rd
- 9621 Harrison Pike
- 8357 Dry Fork Rd
- 8329 Dry Fork Rd
- 8679 Dry Fork Rd
- 8301 Dry Fork Rd
- 8279 Dry Fork Rd
- 9623 Harrison Pike
- 8251 Dry Fork Rd
- 8227 Dry Fork Rd
- 8169 Dry Fork Rd
- 8195 Dry Fork Rd
- 8125 Dry Fork Rd Unit 35
- 8141 Dry Fork Rd
- 9825 Harrison Ave
- 8101 Dry Fork Rd
Your Personal Tour Guide
Ask me questions while you tour the home.