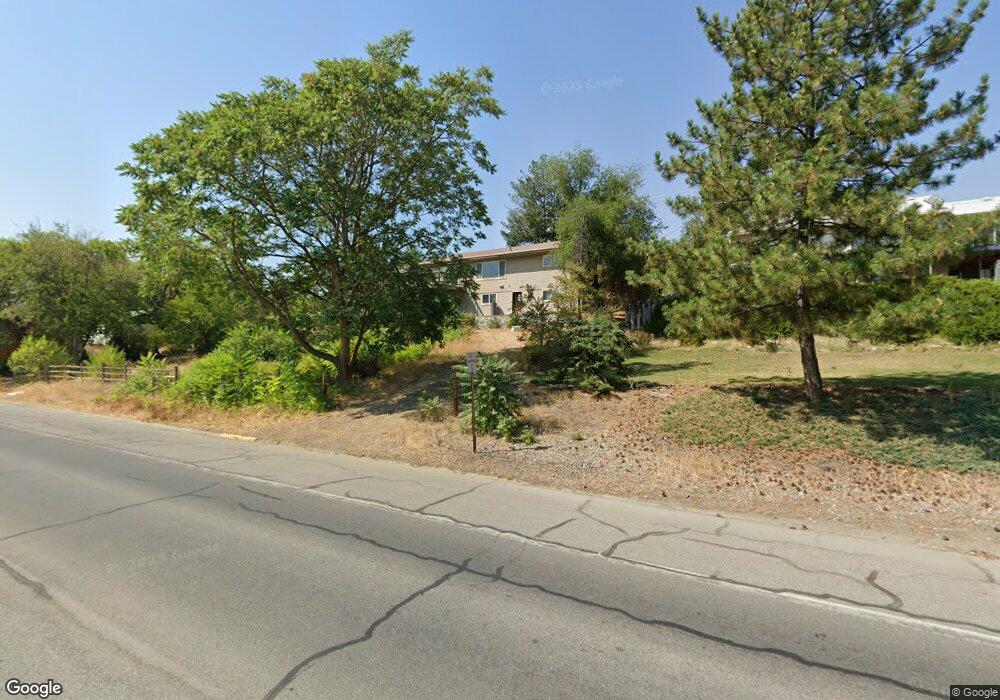
966 3rd Ave N Okanogan, WA 98840
Estimated Value: $363,224 - $518,000
4
Beds
3
Baths
3,311
Sq Ft
$128/Sq Ft
Est. Value
About This Home
This home is located at 966 3rd Ave N, Okanogan, WA 98840 and is currently estimated at $425,306, approximately $128 per square foot. 966 3rd Ave N is a home located in Okanogan County with nearby schools including Grainger Elementary School, Okanogan Middle School, and Okanogan High School.
Ownership History
Date
Name
Owned For
Owner Type
Purchase Details
Closed on
Jun 20, 2012
Sold by
Freestone Charles R
Bought by
Mcguin Rashell
Current Estimated Value
Home Financials for this Owner
Home Financials are based on the most recent Mortgage that was taken out on this home.
Original Mortgage
$176,641
Outstanding Balance
$122,073
Interest Rate
3.77%
Mortgage Type
FHA
Estimated Equity
$303,233
Create a Home Valuation Report for This Property
The Home Valuation Report is an in-depth analysis detailing your home's value as well as a comparison with similar homes in the area
Home Values in the Area
Average Home Value in this Area
Purchase History
| Date | Buyer | Sale Price | Title Company |
|---|---|---|---|
| Mcguin Rashell | $179,900 | Inland Professional Title |
Source: Public Records
Mortgage History
| Date | Status | Borrower | Loan Amount |
|---|---|---|---|
| Open | Mcguin Rashell | $176,641 |
Source: Public Records
Tax History Compared to Growth
Tax History
| Year | Tax Paid | Tax Assessment Tax Assessment Total Assessment is a certain percentage of the fair market value that is determined by local assessors to be the total taxable value of land and additions on the property. | Land | Improvement |
|---|---|---|---|---|
| 2025 | $3,337 | $338,600 | $21,400 | $317,200 |
| 2024 | $3,337 | $317,800 | $21,400 | $296,400 |
| 2022 | $3,182 | $237,700 | $21,400 | $216,300 |
| 2021 | $3,177 | $237,700 | $21,400 | $216,300 |
| 2020 | $2,605 | $229,700 | $21,400 | $208,300 |
| 2019 | $2,466 | $181,600 | $21,400 | $160,200 |
| 2018 | $2,635 | $163,500 | $21,400 | $142,100 |
| 2017 | $2,230 | $163,500 | $21,400 | $142,100 |
| 2016 | $2,226 | $163,500 | $21,400 | $142,100 |
| 2015 | $2,169 | $163,500 | $21,400 | $142,100 |
| 2013 | -- | $163,500 | $21,400 | $142,100 |
Source: Public Records
Map
Nearby Homes