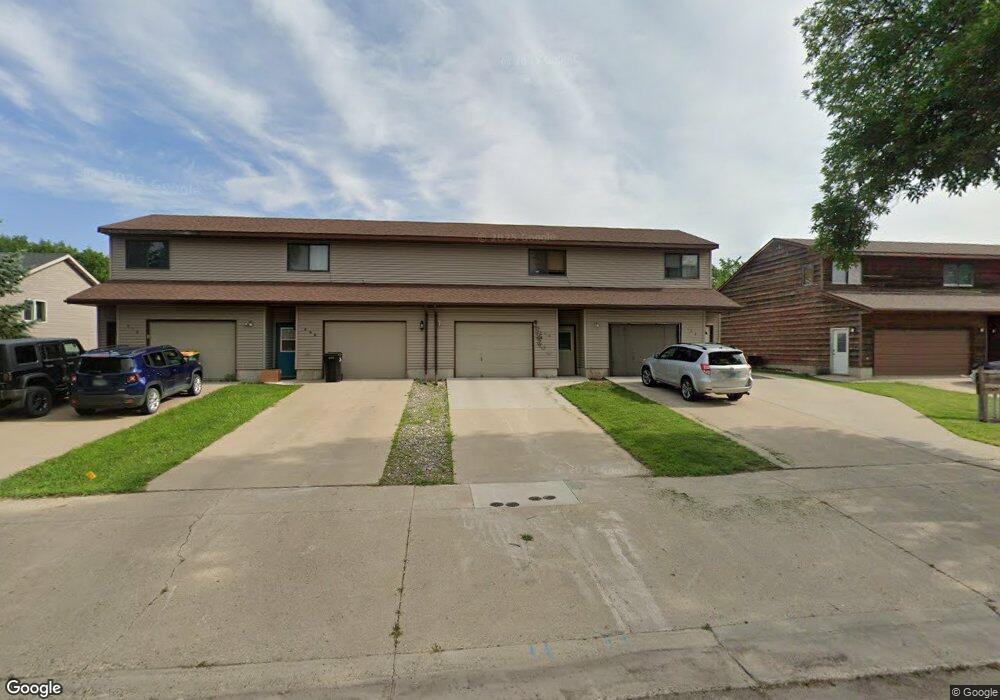
966 4th Ave W West Fargo, ND 58078
West Side NeighborhoodEstimated Value: $205,000 - $211,412
2
Beds
2
Baths
960
Sq Ft
$217/Sq Ft
Est. Value
About This Home
This home is located at 966 4th Ave W, West Fargo, ND 58078 and is currently estimated at $208,206, approximately $216 per square foot. 966 4th Ave W is a home located in Cass County with nearby schools including Westside Elementary School, Cheney Middle School, and West Fargo High School.
Ownership History
Date
Name
Owned For
Owner Type
Purchase Details
Closed on
Jun 24, 2014
Sold by
Schmidt Jordan L
Bought by
Smith Felicia J
Current Estimated Value
Home Financials for this Owner
Home Financials are based on the most recent Mortgage that was taken out on this home.
Original Mortgage
$87,000
Outstanding Balance
$65,949
Interest Rate
4.11%
Mortgage Type
New Conventional
Estimated Equity
$142,257
Purchase Details
Closed on
Jun 22, 2012
Sold by
Heick Shawn L and Heick Heather
Bought by
Schmidt Jordan L
Home Financials for this Owner
Home Financials are based on the most recent Mortgage that was taken out on this home.
Original Mortgage
$92,591
Interest Rate
4.15%
Mortgage Type
FHA
Create a Home Valuation Report for This Property
The Home Valuation Report is an in-depth analysis detailing your home's value as well as a comparison with similar homes in the area
Home Values in the Area
Average Home Value in this Area
Purchase History
| Date | Buyer | Sale Price | Title Company |
|---|---|---|---|
| Smith Felicia J | $116,000 | Fm Title | |
| Schmidt Jordan L | -- | Fm Title |
Source: Public Records
Mortgage History
| Date | Status | Borrower | Loan Amount |
|---|---|---|---|
| Open | Smith Felicia J | $87,000 | |
| Previous Owner | Schmidt Jordan L | $92,591 |
Source: Public Records
Tax History Compared to Growth
Tax History
| Year | Tax Paid | Tax Assessment Tax Assessment Total Assessment is a certain percentage of the fair market value that is determined by local assessors to be the total taxable value of land and additions on the property. | Land | Improvement |
|---|---|---|---|---|
| 2024 | $1,868 | $78,600 | $12,500 | $66,100 |
| 2023 | $2,290 | $75,450 | $12,500 | $62,950 |
| 2022 | $2,267 | $71,800 | $12,500 | $59,300 |
| 2021 | $2,155 | $64,100 | $8,750 | $55,350 |
| 2020 | $2,150 | $65,650 | $8,750 | $56,900 |
| 2019 | $2,088 | $63,200 | $8,750 | $54,450 |
| 2018 | $1,965 | $61,250 | $8,750 | $52,500 |
| 2017 | $1,810 | $61,250 | $8,750 | $52,500 |
| 2016 | $1,426 | $56,950 | $8,750 | $48,200 |
| 2015 | $1,438 | $52,900 | $3,400 | $49,500 |
| 2014 | $1,409 | $49,450 | $3,400 | $46,050 |
| 2013 | $1,319 | $46,450 | $3,400 | $43,050 |
Source: Public Records
Map
Nearby Homes
- 719 5th Ave W
- 1165 7th Ave W
- 520 6th Ave W Unit 8
- 514 7th Ave W
- 744 Elm St
- 431 Morrison St
- 830 12th Ave W
- 109 5th Ave W
- 226 10 1/2 Ave W
- 1447 Elmwood Ct
- 109 7th Ave E
- 209 1st Ave E
- 723 16th Ave W
- 52 Pinewood Blvd
- TBD 4th Ave NW
- 237 10th Ave E
- 232 15th Ave W
- 78 Evergreen Cir
- 243 12 1 2 Ave E
- 426 3rd Ave E