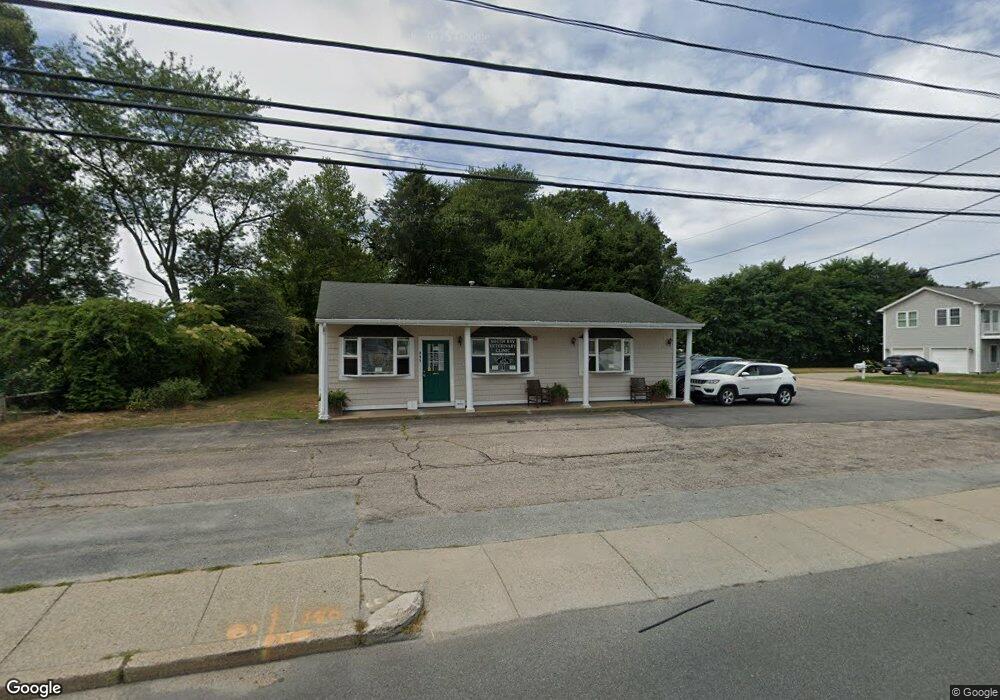
966 Boston Neck Rd Narragansett, RI 02882
Estimated Value: $625,937
--
Bed
--
Bath
1,134
Sq Ft
$552/Sq Ft
Est. Value
About This Home
This home is located at 966 Boston Neck Rd, Narragansett, RI 02882 and is currently estimated at $625,937, approximately $551 per square foot. 966 Boston Neck Rd is a home located in Washington County with nearby schools including Narragansett Elementary School, Narragansett Pier Middle School, and Narragansett High School.
Ownership History
Date
Name
Owned For
Owner Type
Purchase Details
Closed on
Oct 27, 2008
Sold by
Patterson Kristen
Bought by
Bowater Realty Llc
Current Estimated Value
Home Financials for this Owner
Home Financials are based on the most recent Mortgage that was taken out on this home.
Original Mortgage
$294,600
Outstanding Balance
$154,087
Interest Rate
5.94%
Mortgage Type
Commercial
Estimated Equity
$471,850
Purchase Details
Closed on
Jul 15, 2002
Sold by
Golden Edward M and Golden Judith A
Bought by
Carty Marguerite R and Carty Michael W
Home Financials for this Owner
Home Financials are based on the most recent Mortgage that was taken out on this home.
Original Mortgage
$150,000
Interest Rate
6.79%
Mortgage Type
Commercial
Create a Home Valuation Report for This Property
The Home Valuation Report is an in-depth analysis detailing your home's value as well as a comparison with similar homes in the area
Home Values in the Area
Average Home Value in this Area
Purchase History
| Date | Buyer | Sale Price | Title Company |
|---|---|---|---|
| Bowater Realty Llc | $300,000 | -- | |
| Bowater Realty Llc | $300,000 | -- | |
| Carty Marguerite R | $190,000 | -- | |
| Carty Marguerite R | $190,000 | -- |
Source: Public Records
Mortgage History
| Date | Status | Borrower | Loan Amount |
|---|---|---|---|
| Closed | Carty Marguerite R | $0 | |
| Open | Carty Marguerite R | $294,600 | |
| Closed | Carty Marguerite R | $294,600 | |
| Previous Owner | Carty Marguerite R | $150,000 |
Source: Public Records
Tax History Compared to Growth
Tax History
| Year | Tax Paid | Tax Assessment Tax Assessment Total Assessment is a certain percentage of the fair market value that is determined by local assessors to be the total taxable value of land and additions on the property. | Land | Improvement |
|---|---|---|---|---|
| 2025 | $3,612 | $393,900 | $278,200 | $115,700 |
| 2024 | $3,482 | $393,900 | $278,200 | $115,700 |
| 2023 | $3,356 | $267,000 | $164,200 | $102,800 |
| 2022 | $3,241 | $267,000 | $164,200 | $102,800 |
| 2021 | $3,193 | $267,000 | $164,200 | $102,800 |
| 2020 | $3,738 | $264,200 | $153,500 | $110,700 |
| 2019 | $3,786 | $264,200 | $153,500 | $110,700 |
| 2018 | $3,680 | $264,200 | $153,500 | $110,700 |
| 2017 | $3,800 | $239,900 | $123,600 | $116,300 |
| 2016 | $3,627 | $239,900 | $123,600 | $116,300 |
| 2015 | $3,577 | $239,900 | $123,600 | $116,300 |
| 2014 | $3,928 | $260,800 | $154,500 | $106,300 |
Source: Public Records
Map
Nearby Homes
- 64 Juniper Trail
- 0 Betty Dr
- 51 Osceola Ave
- 7 Leatherleaf Rd
- 51 Bonnet Shores Rd
- 53 Bonnet Shores Rd
- 80 Old Pine Rd
- 91 Bonnet Point Rd
- 121 Spice Bush Trail
- 55 Bonnet Shores Rd
- 59 Spice Bush Trail
- 137 Bonnet Shores Rd
- 11 Tupelo Trail
- 47 Wayland Trail
- 46 S River Dr
- 18 Lakeview Dr
- 20 Anchorage Rd
- 74 Bayberry Rd
- 18 Anawan Ave
- 727 Boston Neck Rd
- 8 Conanicus Rd
- 1 Old Pine Rd
- 43 Allagash Trail
- 976 Boston Neck Rd
- 3 Old Pine Rd
- 12 Conanicus Rd
- 961 Boston Neck Rd
- 13 Conanicus Rd
- 35 Allagash Trail
- 5 Old Pine Rd
- 63 Sassafras Trail
- 45 Allagash Trail
- 5 Hogan Ave
- 954 Boston Neck Rd
- 18 Juliet Rd
- 18 Conanicus Rd
- 44 Allagash Trail
- 31 Allagash Trail
- 9 Old Pine Rd
- 19 Conanicus Rd