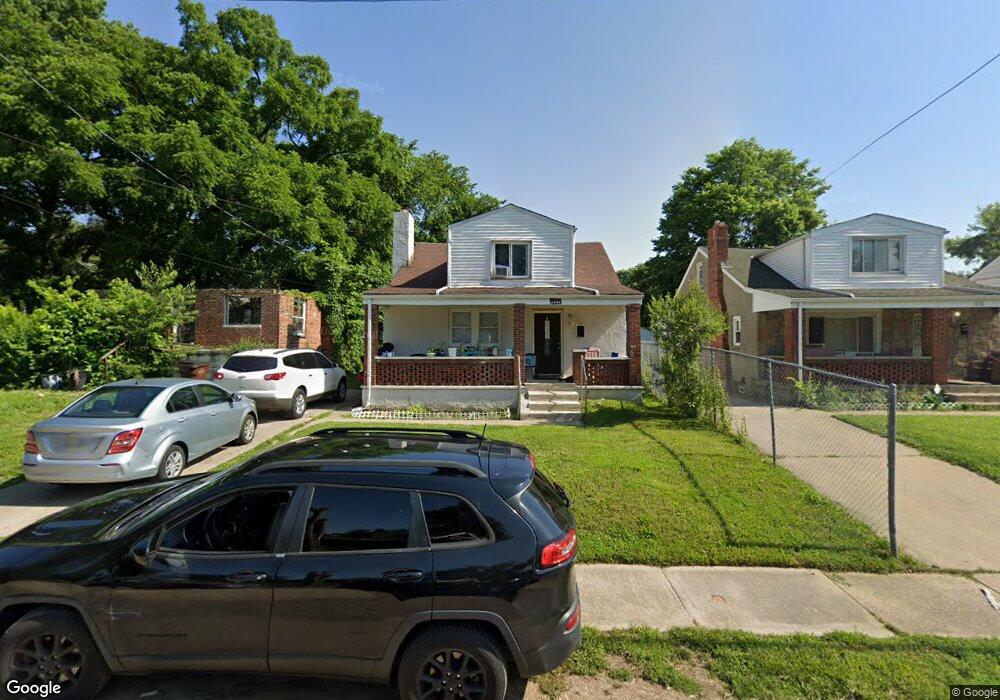
966 Byrd Ave Cincinnati, OH 45215
Estimated Value: $117,000 - $186,000
4
Beds
3
Baths
2,325
Sq Ft
$68/Sq Ft
Est. Value
About This Home
This home is located at 966 Byrd Ave, Cincinnati, OH 45215 and is currently estimated at $158,078, approximately $67 per square foot. 966 Byrd Ave is a home located in Hamilton County with nearby schools including Lincoln Heights Elementary School, Princeton Community Middle School, and Princeton High School.
Ownership History
Date
Name
Owned For
Owner Type
Purchase Details
Closed on
May 1, 2009
Sold by
Lot King Limited Partnership
Bought by
Brooks Christina R
Current Estimated Value
Home Financials for this Owner
Home Financials are based on the most recent Mortgage that was taken out on this home.
Original Mortgage
$12,189
Outstanding Balance
$7,651
Interest Rate
5.05%
Mortgage Type
Seller Take Back
Estimated Equity
$150,427
Purchase Details
Closed on
Apr 13, 2009
Sold by
Federal Home Loan Mortgage Corporation
Bought by
Lot King Limited Partnership
Home Financials for this Owner
Home Financials are based on the most recent Mortgage that was taken out on this home.
Original Mortgage
$12,189
Outstanding Balance
$7,651
Interest Rate
5.05%
Mortgage Type
Seller Take Back
Estimated Equity
$150,427
Purchase Details
Closed on
Dec 17, 2008
Sold by
Young Nathaniel and Young Roxie
Bought by
Citimortgage Inc
Purchase Details
Closed on
Apr 2, 2002
Sold by
Young Nathaniel
Bought by
Young Roxie
Purchase Details
Closed on
Jul 26, 2001
Sold by
Pickens Joe
Bought by
Young Nathaniel
Create a Home Valuation Report for This Property
The Home Valuation Report is an in-depth analysis detailing your home's value as well as a comparison with similar homes in the area
Home Values in the Area
Average Home Value in this Area
Purchase History
| Date | Buyer | Sale Price | Title Company |
|---|---|---|---|
| Brooks Christina R | $14,689 | Attorney | |
| Lot King Limited Partnership | $12,000 | Attorney | |
| Citimortgage Inc | $28,000 | None Available | |
| Young Roxie | -- | -- | |
| Young Nathaniel | $25,000 | -- |
Source: Public Records
Mortgage History
| Date | Status | Borrower | Loan Amount |
|---|---|---|---|
| Open | Brooks Christina R | $12,189 |
Source: Public Records
Tax History
| Year | Tax Paid | Tax Assessment Tax Assessment Total Assessment is a certain percentage of the fair market value that is determined by local assessors to be the total taxable value of land and additions on the property. | Land | Improvement |
|---|---|---|---|---|
| 2025 | $2,829 | $35,064 | $1,236 | $33,828 |
| 2024 | $2,415 | $35,064 | $1,236 | $33,828 |
| 2023 | $2,385 | $35,064 | $1,236 | $33,828 |
| 2022 | $1,482 | $14,218 | $1,236 | $12,982 |
| 2021 | $1,477 | $14,218 | $1,236 | $12,982 |
| 2020 | $1,466 | $14,218 | $1,236 | $12,982 |
| 2019 | $1,546 | $14,218 | $1,236 | $12,982 |
| 2018 | $1,497 | $14,218 | $1,236 | $12,982 |
| 2017 | $1,459 | $14,218 | $1,236 | $12,982 |
| 2016 | $180 | $1,974 | $1,561 | $413 |
| 2015 | $190 | $1,974 | $1,561 | $413 |
| 2014 | $195 | $1,974 | $1,561 | $413 |
| 2013 | $236 | $2,471 | $1,953 | $518 |
Source: Public Records
Map
Nearby Homes
- 857 Steffen Ave
- 1076 Schumard Ave
- 1282 Steffen Ave
- 1401 Chamberlain Ave
- 519 Westview Ave
- 405 Home Ave
- 1201 Dixie Ct
- 1118 Burns Ave
- 1019 Crosley Ave
- 15 Bonham Rd
- 10152 Chester Rd
- 1239 Springfield Pike
- 1704 Harmon Dr
- 1100 Timberland Dr
- 127 Locust St
- 502 Marion Rd
- 701 W Wyoming Ave
- 11 Rolling Hills Ct
- 217 W Wyoming Ave
- 10167 Wayne Ave
- 954 Byrd Ave
- 976 Byrd Ave
- 944 Byrd Ave
- 988 Byrd Ave
- 1000 Byrd Ave
- 932 Byrd Ave
- 932 Byrd Ave Unit 200
- 943 Chamberlain Ave
- 989 Chamberlain Ave
- 913 Chamberlain Ave
- 910 Byrd Ave
- 1002 Byrd Ave
- 967 Byrd Ave
- 1001 Chamberlain Ave
- 977 Byrd Ave
- 947 Byrd Ave
- 923 Chamberlain Ave
- 1011 Chamberlain Ave
- 1001 Byrd Ave
- 1022 Byrd Ave
Your Personal Tour Guide
Ask me questions while you tour the home.