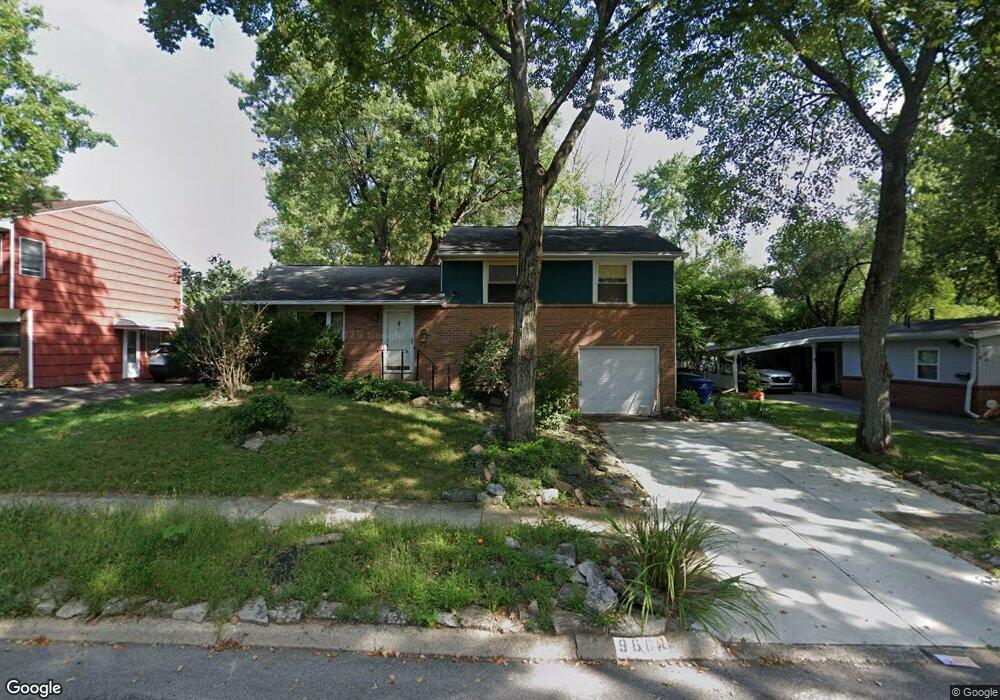
966 Caniff Rd Columbus, OH 43221
Cranbrook NeighborhoodEstimated Value: $344,094 - $369,000
3
Beds
2
Baths
1,344
Sq Ft
$265/Sq Ft
Est. Value
About This Home
This home is located at 966 Caniff Rd, Columbus, OH 43221 and is currently estimated at $356,774, approximately $265 per square foot. 966 Caniff Rd is a home located in Franklin County with nearby schools including Cranbrook Elementary School, Ridgeview Middle School, and Centennial High School.
Ownership History
Date
Name
Owned For
Owner Type
Purchase Details
Closed on
Jun 30, 1999
Sold by
Poling Robert A
Bought by
Naffziger Miller John S and Naffziger Miller Jennifer
Current Estimated Value
Home Financials for this Owner
Home Financials are based on the most recent Mortgage that was taken out on this home.
Original Mortgage
$122,400
Outstanding Balance
$33,554
Interest Rate
7.29%
Mortgage Type
VA
Estimated Equity
$323,220
Purchase Details
Closed on
Jun 17, 1996
Sold by
Amicon Kenneth E
Bought by
Robert A Poling
Home Financials for this Owner
Home Financials are based on the most recent Mortgage that was taken out on this home.
Original Mortgage
$107,250
Interest Rate
8.05%
Mortgage Type
New Conventional
Purchase Details
Closed on
Aug 30, 1991
Purchase Details
Closed on
Jun 1, 1986
Create a Home Valuation Report for This Property
The Home Valuation Report is an in-depth analysis detailing your home's value as well as a comparison with similar homes in the area
Home Values in the Area
Average Home Value in this Area
Purchase History
| Date | Buyer | Sale Price | Title Company |
|---|---|---|---|
| Naffziger Miller John S | $120,000 | Chicago Title | |
| Robert A Poling | $112,900 | -- | |
| -- | $87,900 | -- | |
| -- | $42,000 | -- |
Source: Public Records
Mortgage History
| Date | Status | Borrower | Loan Amount |
|---|---|---|---|
| Open | Naffziger Miller John S | $122,400 | |
| Previous Owner | Robert A Poling | $107,250 |
Source: Public Records
Tax History Compared to Growth
Tax History
| Year | Tax Paid | Tax Assessment Tax Assessment Total Assessment is a certain percentage of the fair market value that is determined by local assessors to be the total taxable value of land and additions on the property. | Land | Improvement |
|---|---|---|---|---|
| 2024 | $3,544 | $88,770 | $40,640 | $48,130 |
| 2023 | $3,527 | $88,760 | $40,635 | $48,125 |
| 2022 | $3,222 | $70,880 | $21,630 | $49,250 |
| 2021 | $3,228 | $70,880 | $21,630 | $49,250 |
| 2020 | $3,232 | $70,880 | $21,630 | $49,250 |
| 2019 | $3,024 | $58,590 | $21,630 | $36,960 |
| 2018 | $2,730 | $58,590 | $21,630 | $36,960 |
| 2017 | $3,022 | $58,590 | $21,630 | $36,960 |
| 2016 | $2,690 | $49,360 | $14,530 | $34,830 |
| 2015 | $2,442 | $49,360 | $14,530 | $34,830 |
| 2014 | $2,448 | $49,360 | $14,530 | $34,830 |
| 2013 | $1,398 | $47,005 | $13,825 | $33,180 |
Source: Public Records
Map
Nearby Homes
- 1121 Afton Rd
- 1016 Lambeth Dr
- 1059 Lambeth Dr
- 3311 Mansion Way
- 1098 Stanhope Dr
- 965 Manor Ln Unit W
- 965 Manor Ln Unit P
- 1310 Stoneygate Ln
- 1315 La Rochelle Dr Unit B2U
- 3526 Rue de Fleur Unit B18U
- 1311 La Rochelle Dr Unit B2L
- 667 Riverview Dr
- 3051 Wilce Ave
- 1109 Millcreek Ln
- 1206 Kenbrook Hills Dr
- 1560 Pemberton Dr
- 745 Highland Dr
- 718 Highland Dr
- 3281 Milton Ave
- 1763-1769 Ardleigh Rd Unit 1763-1769