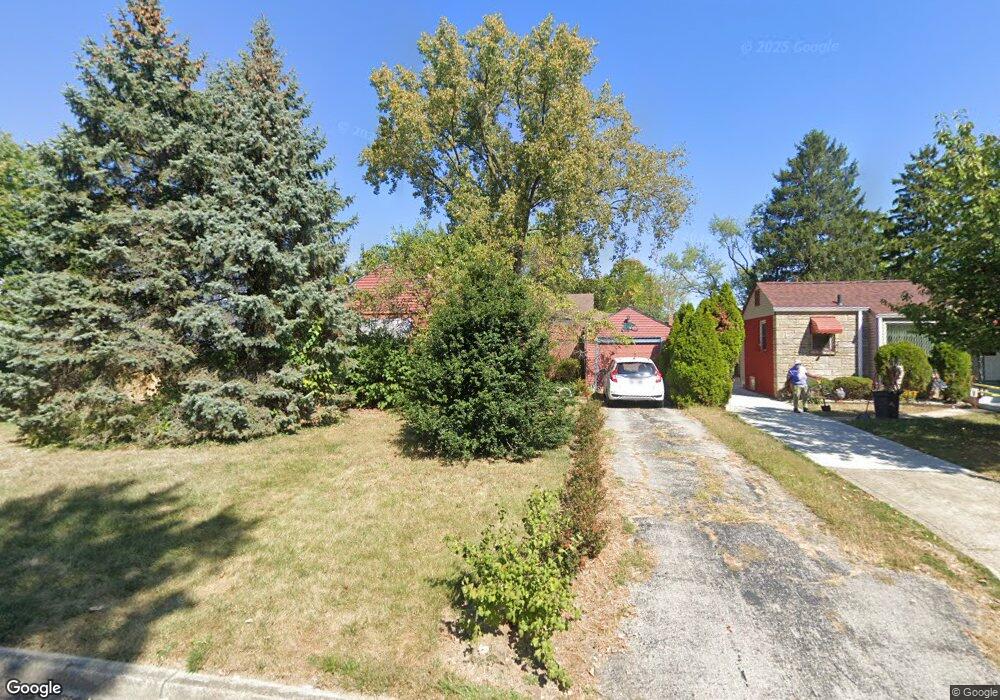
966 E Dunedin Rd Columbus, OH 43224
North Linden NeighborhoodEstimated Value: $159,224 - $188,000
2
Beds
1
Bath
712
Sq Ft
$243/Sq Ft
Est. Value
About This Home
This home is located at 966 E Dunedin Rd, Columbus, OH 43224 and is currently estimated at $173,306, approximately $243 per square foot. 966 E Dunedin Rd is a home located in Franklin County with nearby schools including Huy Elementary School, Medina Middle School, and Mifflin High School.
Ownership History
Date
Name
Owned For
Owner Type
Purchase Details
Closed on
Mar 5, 2003
Sold by
Larochelle Jon D
Bought by
Rambo-Foley Deborah A
Current Estimated Value
Home Financials for this Owner
Home Financials are based on the most recent Mortgage that was taken out on this home.
Original Mortgage
$65,964
Outstanding Balance
$27,731
Interest Rate
6.07%
Mortgage Type
FHA
Estimated Equity
$145,575
Purchase Details
Closed on
Mar 24, 1997
Sold by
Farlow Rick A
Bought by
Larochelle Jon D and Larochelle Sherry R
Home Financials for this Owner
Home Financials are based on the most recent Mortgage that was taken out on this home.
Original Mortgage
$43,554
Interest Rate
7.82%
Mortgage Type
FHA
Purchase Details
Closed on
Jun 20, 1994
Sold by
Martinez Richard
Bought by
Rick A Farlow
Home Financials for this Owner
Home Financials are based on the most recent Mortgage that was taken out on this home.
Original Mortgage
$39,400
Interest Rate
8.58%
Mortgage Type
New Conventional
Purchase Details
Closed on
Dec 1, 1986
Create a Home Valuation Report for This Property
The Home Valuation Report is an in-depth analysis detailing your home's value as well as a comparison with similar homes in the area
Home Values in the Area
Average Home Value in this Area
Purchase History
| Date | Buyer | Sale Price | Title Company |
|---|---|---|---|
| Rambo-Foley Deborah A | $67,000 | -- | |
| Larochelle Jon D | $43,400 | -- | |
| Rick A Farlow | $41,500 | -- | |
| -- | $43,000 | -- |
Source: Public Records
Mortgage History
| Date | Status | Borrower | Loan Amount |
|---|---|---|---|
| Open | Rambo-Foley Deborah A | $65,964 | |
| Previous Owner | Larochelle Jon D | $43,554 | |
| Previous Owner | Rick A Farlow | $39,400 |
Source: Public Records
Tax History
| Year | Tax Paid | Tax Assessment Tax Assessment Total Assessment is a certain percentage of the fair market value that is determined by local assessors to be the total taxable value of land and additions on the property. | Land | Improvement |
|---|---|---|---|---|
| 2025 | $2,300 | $51,250 | $14,740 | $36,510 |
| 2024 | $2,300 | $51,250 | $14,740 | $36,510 |
| 2023 | $2,271 | $51,240 | $14,735 | $36,505 |
| 2022 | $1,503 | $28,980 | $7,140 | $21,840 |
| 2021 | $1,506 | $28,980 | $7,140 | $21,840 |
| 2020 | $1,508 | $28,980 | $7,140 | $21,840 |
| 2019 | $1,378 | $22,720 | $5,740 | $16,980 |
| 2018 | $1,341 | $22,720 | $5,740 | $16,980 |
| 2017 | $1,377 | $22,720 | $5,740 | $16,980 |
| 2016 | $1,440 | $21,740 | $5,740 | $16,000 |
| 2015 | $1,307 | $21,740 | $5,740 | $16,000 |
| 2014 | $1,311 | $21,740 | $5,740 | $16,000 |
| 2013 | $681 | $22,890 | $6,055 | $16,835 |
Source: Public Records
Map
Nearby Homes
- 1120 Piedmont Rd
- 796 E Kenworth Rd
- 1090 Pauline Ave
- 914 Weldon Ave
- 3546 Beulah Rd
- 3147 Grasmere Ave
- 3268 McGuffey Rd
- 3035 Audubon Rd
- 759 E Longview Ave
- 1046 Northridge Rd
- 1303 Oakland Park Ave
- 780 Moon Rd
- 1242 Acton Rd
- 3352 Karl Rd
- 589 Clinton Heights Ave
- 3401 Walmar Dr
- 2950 Grasmere Ave
- 991 Hidden Acres Ct Unit 991
- 773 Melrose Ave
- 2897 Grasmere Ave
- 972 E Dunedin Rd
- 960 E Dunedin Rd
- 978 E Dunedin Rd
- 984 E Dunedin Rd
- 975 Piedmont Rd
- 981 Piedmont Rd
- 969 Piedmont Rd
- 3356 Maize Rd
- 3350 Maize Rd
- 3360 Maize Rd
- 987 Piedmont Rd
- 963 E Dunedin Rd
- 990 E Dunedin Rd
- 957 E Dunedin Rd
- 3368 Maize Rd
- 969 E Dunedin Rd
- 993 Piedmont Rd
- 975 E Dunedin Rd
- 3374 Maize Rd
- 3332-3338 Maize Rd
Your Personal Tour Guide
Ask me questions while you tour the home.