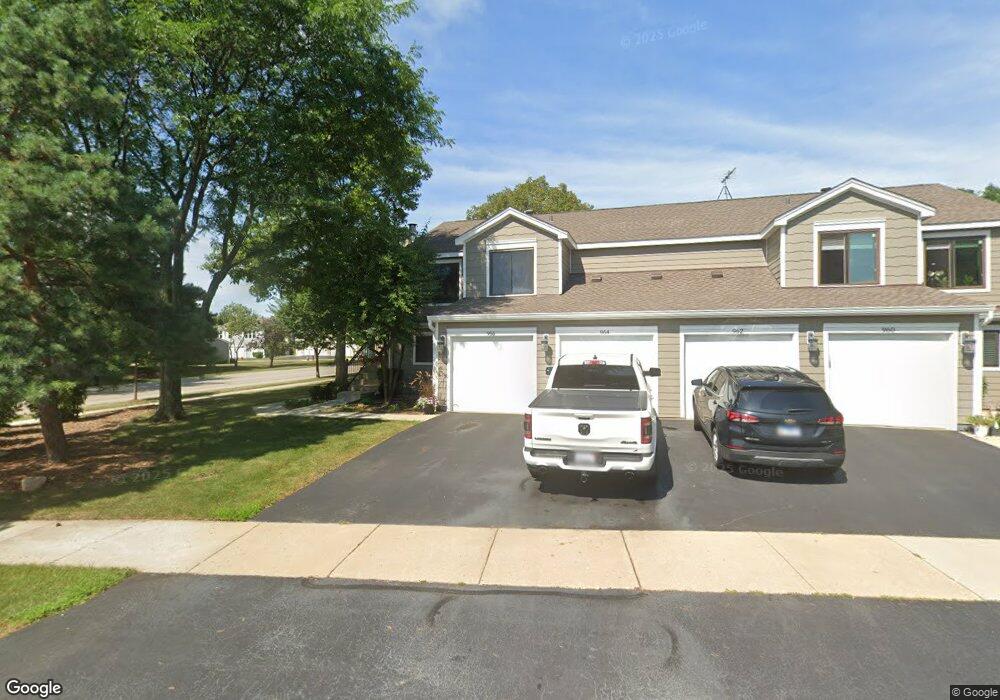
966 Glouchester Cir Unit 181A Schaumburg, IL 60193
South Schaumburg NeighborhoodEstimated Value: $266,008 - $278,000
2
Beds
--
Bath
1,200
Sq Ft
$228/Sq Ft
Est. Value
About This Home
This home is located at 966 Glouchester Cir Unit 181A, Schaumburg, IL 60193 and is currently estimated at $274,002, approximately $228 per square foot. 966 Glouchester Cir Unit 181A is a home located in Cook County with nearby schools including Michael Collins Elementary School, Robert Frost Junior High School, and J B Conant High School.
Ownership History
Date
Name
Owned For
Owner Type
Purchase Details
Closed on
Jun 24, 2004
Sold by
Walls Jack E and Walls Nancy
Bought by
Laut Jennifer A
Current Estimated Value
Home Financials for this Owner
Home Financials are based on the most recent Mortgage that was taken out on this home.
Original Mortgage
$124,000
Interest Rate
6.35%
Mortgage Type
Unknown
Purchase Details
Closed on
Jun 6, 2003
Sold by
Bianco Anthony Charles and Bianco Simone
Bought by
Walls Jack and Walls Nancy
Purchase Details
Closed on
Jun 1, 1998
Sold by
Rosero Francine
Bought by
Bianco Anthony Charles and Bianco Simone
Home Financials for this Owner
Home Financials are based on the most recent Mortgage that was taken out on this home.
Original Mortgage
$73,440
Interest Rate
7.32%
Mortgage Type
VA
Purchase Details
Closed on
Nov 30, 1994
Sold by
Onorato Erma V
Bought by
Rosero Francine
Create a Home Valuation Report for This Property
The Home Valuation Report is an in-depth analysis detailing your home's value as well as a comparison with similar homes in the area
Home Values in the Area
Average Home Value in this Area
Purchase History
| Date | Buyer | Sale Price | Title Company |
|---|---|---|---|
| Laut Jennifer A | $179,000 | Atgf Inc | |
| Walls Jack | -- | Git | |
| Walls Jack | -- | Git | |
| Bianco Anthony Charles | $72,000 | Lawyers Title Insurance Corp | |
| Rosero Francine | -- | -- |
Source: Public Records
Mortgage History
| Date | Status | Borrower | Loan Amount |
|---|---|---|---|
| Previous Owner | Laut Jennifer A | $124,000 | |
| Previous Owner | Bianco Anthony Charles | $73,440 |
Source: Public Records
Tax History Compared to Growth
Tax History
| Year | Tax Paid | Tax Assessment Tax Assessment Total Assessment is a certain percentage of the fair market value that is determined by local assessors to be the total taxable value of land and additions on the property. | Land | Improvement |
|---|---|---|---|---|
| 2024 | $3,993 | $17,570 | $4,117 | $13,453 |
| 2023 | $3,843 | $17,570 | $4,117 | $13,453 |
| 2022 | $3,843 | $17,570 | $4,117 | $13,453 |
| 2021 | $3,280 | $14,152 | $2,245 | $11,907 |
| 2020 | $3,291 | $14,152 | $2,245 | $11,907 |
| 2019 | $3,296 | $15,725 | $2,245 | $13,480 |
| 2018 | $2,247 | $10,922 | $1,871 | $9,051 |
| 2017 | $2,229 | $10,922 | $1,871 | $9,051 |
| 2016 | $2,327 | $10,922 | $1,871 | $9,051 |
| 2015 | $2,120 | $9,711 | $1,684 | $8,027 |
| 2014 | $2,113 | $9,711 | $1,684 | $8,027 |
| 2013 | $2,042 | $9,711 | $1,684 | $8,027 |
Source: Public Records
Map
Nearby Homes
- 126 Manchester Ct Unit 61B
- 916 Manchester Cir Unit 91A
- 205 Nantucket Harbor Unit 104
- 36 Shore Dr
- 1100 Boston Harbor Unit 7004
- 421 E Wise Rd
- 426 E Niagara Ave
- 124 E Monterey Ave
- 733 Limerick Ln Unit 7333D
- 711 Tipperary Ct Unit 2D
- 727 Killarney Ct Unit 1C
- 631 Derry Ct Unit 3C
- 718 N Point Dr
- 635 Limerick Ln Unit 2B
- 614 Tralee Ct Unit 2-C
- 620 S Point Dr
- 421 Summit Dr
- 722 Merlin Dr Unit 16
- 826 Thornton Ct Unit 2AL
- 1623 Indian Hill Dr
- 960 Glouchester Cir Unit 181B
- 964 Glouchester Cir Unit 182A
- 962 Glouchester Cir Unit 182B
- 956 Glouchester Cir Unit 191A
- 220 E Hartford Dr Unit 171A
- 224 E Hartford Dr Unit 172B
- 954 Glouchester Cir Unit 192A
- 226 E Hartford Dr Unit 171B
- 950 Glouchester Cir Unit 191B
- 222 E Hartford Dr Unit 172A
- 1026 Glouchester Harbor Unit 3204
- 952 Glouchester Cir Unit 192B
- 1020 Glouchester Harbor Unit 3201
- 965 Glouchester Cir Unit 222B
- 961 Glouchester Cir Unit 221A
- 1022 Glouchester Harbor
- 1024 Glouchester Harbor Unit 3203
- 941 Glouchester Cir Unit 201A
- 943 Glouchester Cir Unit 202A
- 1021 Glouchester Harbor