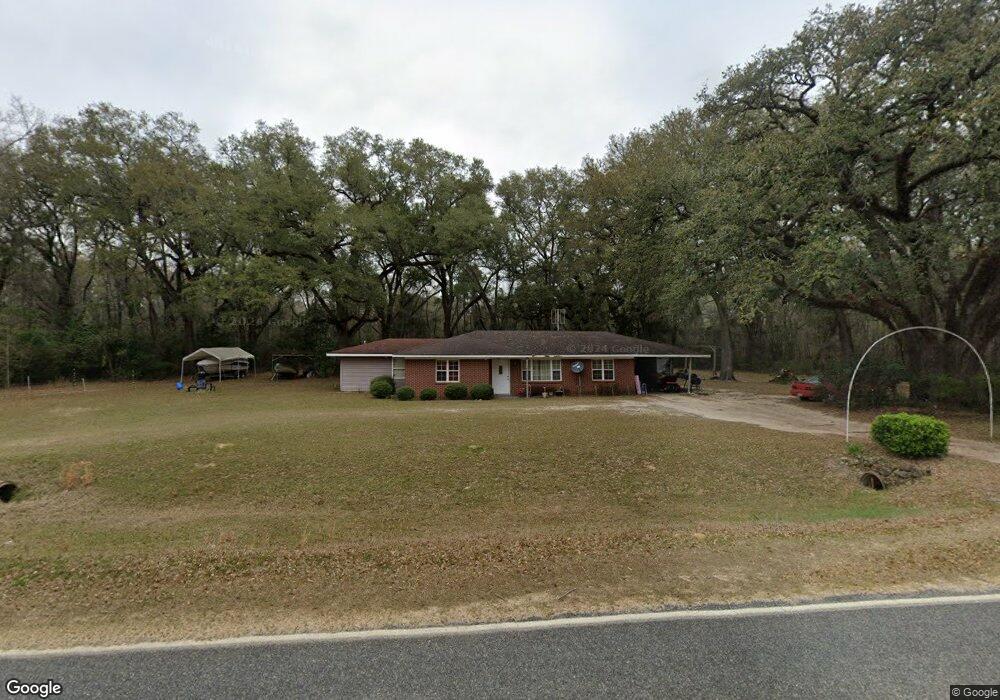
966 Griggs Lucille Rd Colquitt, GA 39837
Estimated Value: $149,000 - $221,000
3
Beds
2
Baths
1,415
Sq Ft
$126/Sq Ft
Est. Value
About This Home
This home is located at 966 Griggs Lucille Rd, Colquitt, GA 39837 and is currently estimated at $178,991, approximately $126 per square foot. 966 Griggs Lucille Rd is a home located in Miller County with nearby schools including Miller County Elementary School, Miller County Middle School, and Miller County High School.
Ownership History
Date
Name
Owned For
Owner Type
Purchase Details
Closed on
Nov 23, 2016
Sold by
Webley Everton and Webley Stephanie
Bought by
Sirmons Crystal Lavon
Current Estimated Value
Home Financials for this Owner
Home Financials are based on the most recent Mortgage that was taken out on this home.
Original Mortgage
$104,570
Outstanding Balance
$86,076
Interest Rate
4.25%
Mortgage Type
FHA
Estimated Equity
$92,915
Purchase Details
Closed on
Feb 16, 2006
Sold by
Federal National Mortgage Association
Bought by
Webley Everton and Webley Stephanie
Home Financials for this Owner
Home Financials are based on the most recent Mortgage that was taken out on this home.
Original Mortgage
$89,550
Interest Rate
8.85%
Mortgage Type
New Conventional
Purchase Details
Closed on
Oct 4, 2005
Sold by
Bush David W
Bought by
Gmac Mtg Corp
Purchase Details
Closed on
Mar 29, 1996
Sold by
Phillips Percy A
Bought by
Bush David W
Create a Home Valuation Report for This Property
The Home Valuation Report is an in-depth analysis detailing your home's value as well as a comparison with similar homes in the area
Home Values in the Area
Average Home Value in this Area
Purchase History
| Date | Buyer | Sale Price | Title Company |
|---|---|---|---|
| Sirmons Crystal Lavon | $106,500 | -- | |
| Webley Everton | $99,500 | -- | |
| Gmac Mtg Corp | -- | -- | |
| Bush David W | -- | -- |
Source: Public Records
Mortgage History
| Date | Status | Borrower | Loan Amount |
|---|---|---|---|
| Open | Sirmons Crystal Lavon | $104,570 | |
| Previous Owner | Webley Everton | $89,550 |
Source: Public Records
Tax History Compared to Growth
Tax History
| Year | Tax Paid | Tax Assessment Tax Assessment Total Assessment is a certain percentage of the fair market value that is determined by local assessors to be the total taxable value of land and additions on the property. | Land | Improvement |
|---|---|---|---|---|
| 2024 | $1,868 | $55,579 | $18,615 | $36,964 |
| 2023 | $1,633 | $45,859 | $18,615 | $27,244 |
| 2022 | $1,652 | $43,198 | $18,615 | $24,583 |
| 2021 | $1,635 | $43,198 | $18,615 | $24,583 |
| 2020 | $1,635 | $43,198 | $18,615 | $24,583 |
| 2019 | $1,640 | $43,198 | $18,615 | $24,583 |
| 2018 | $1,593 | $43,198 | $18,615 | $24,583 |
| 2017 | $1,593 | $43,198 | $18,615 | $24,583 |
| 2016 | $1,593 | $43,198 | $18,615 | $24,583 |
| 2015 | -- | $36,614 | $10,496 | $26,118 |
| 2014 | -- | $36,614 | $10,496 | $26,118 |
| 2013 | -- | $36,613 | $10,496 | $26,117 |
Source: Public Records
Map
Nearby Homes
- 755 Mayhaw Rd
- 00 Stein Rd
- Grady Cobb Rd
- 1563 Ga Highway 27 N
- 52 New Hope Rd
- 74 Harmony Church Rd
- 1645 Georgia 91
- 300 N First St
- 210 N First St
- 2835 Georgia 91
- US 27 Us Highway 27
- 157 E Pine St
- 745 Harmony Church Rd
- 102 Bremond St
- 356 E Main St
- 570 E Pine St
- 000 Phillipsburg Rd
- 708 E Crawford St
- 000 Thompson Town Rd
- 721 E Crawford St
- 939 Griggs Lucille Rd
- 957 Griggs Lucille Rd
- 924 Griggs Lucille Rd
- 19 Bean Rd
- 9 Bean Rd
- 368 Davistown Rd
- 903 Griggs Lucille Rd
- 316 Davistown Rd
- 873 Griggs Lucille Rd
- 1032 Griggs Lucille Rd
- 1093 Griggs Lucille Rd
- 1100 Griggs Lucille Rd
- 883 Griggs Lucille Rd
- 859 Griggs Lucille Rd
- 506 Davistown Rd
- 834 Griggs Lucille Rd
- 891 Griggs Lucille Rd
- 141 Bean Rd
- 173 Bean Rd
- 179 Bean Rd