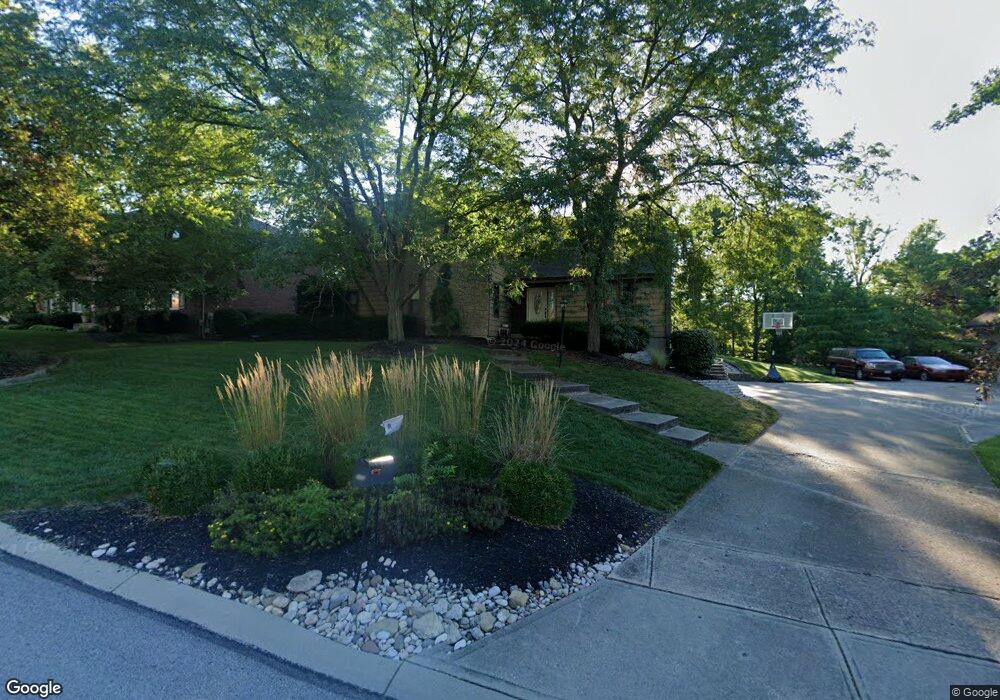
966 Hickoryview Dr Cincinnati, OH 45233
Cotillion Village NeighborhoodEstimated Value: $383,302 - $455,000
4
Beds
4
Baths
2,448
Sq Ft
$173/Sq Ft
Est. Value
About This Home
This home is located at 966 Hickoryview Dr, Cincinnati, OH 45233 and is currently estimated at $424,326, approximately $173 per square foot. 966 Hickoryview Dr is a home located in Hamilton County with nearby schools including John Foster Dulles Elementary School, Rapid Run Middle School, and Oak Hills High School.
Ownership History
Date
Name
Owned For
Owner Type
Purchase Details
Closed on
Jun 30, 2000
Sold by
Lingo Sandra S & Richard M Trs
Bought by
Carolin Joseph F and Heisel Amy L
Current Estimated Value
Home Financials for this Owner
Home Financials are based on the most recent Mortgage that was taken out on this home.
Original Mortgage
$194,750
Interest Rate
8.64%
Purchase Details
Closed on
Jan 23, 1999
Sold by
Lingo Sandra S & Richard M Trs
Bought by
Lingo Richard M and Lingo Sandra S
Create a Home Valuation Report for This Property
The Home Valuation Report is an in-depth analysis detailing your home's value as well as a comparison with similar homes in the area
Home Values in the Area
Average Home Value in this Area
Purchase History
| Date | Buyer | Sale Price | Title Company |
|---|---|---|---|
| Carolin Joseph F | $205,000 | Vintage Title Agency Inc | |
| Lingo Richard M | -- | -- |
Source: Public Records
Mortgage History
| Date | Status | Borrower | Loan Amount |
|---|---|---|---|
| Previous Owner | Carolin Joseph F | $194,750 |
Source: Public Records
Tax History Compared to Growth
Tax History
| Year | Tax Paid | Tax Assessment Tax Assessment Total Assessment is a certain percentage of the fair market value that is determined by local assessors to be the total taxable value of land and additions on the property. | Land | Improvement |
|---|---|---|---|---|
| 2024 | $5,822 | $100,486 | $15,901 | $84,585 |
| 2023 | $5,840 | $100,486 | $15,901 | $84,585 |
| 2022 | $5,487 | $83,972 | $14,791 | $69,181 |
| 2021 | $5,373 | $83,972 | $14,791 | $69,181 |
| 2020 | $5,450 | $83,972 | $14,791 | $69,181 |
| 2019 | $5,227 | $72,391 | $12,751 | $59,640 |
| 2018 | $5,232 | $72,391 | $12,751 | $59,640 |
| 2017 | $4,723 | $72,391 | $12,751 | $59,640 |
| 2016 | $4,771 | $73,252 | $12,786 | $60,466 |
| 2015 | $4,777 | $73,252 | $12,786 | $60,466 |
| 2014 | $4,782 | $73,252 | $12,786 | $60,466 |
| 2013 | $4,838 | $78,764 | $13,748 | $65,016 |
Source: Public Records
Map
Nearby Homes
- 5819 Faysel Dr
- 760 Stonebridge Dr
- 5789 Juvene Way
- 5861 Chapelhill Dr
- 6226 Rapid Run Rd
- 1366 Devils Backbone Rd
- 6278 Gardenlake Ct
- 1706 Beech Grove Dr
- 1259 Wexford Ln
- 1676 Devils Backbone Rd
- 1713 Ebenezer Rd
- 6474 Simon Dr
- 5318 Hillside Ave
- 5320 Hillside Ave
- 2000 Beech Grove Dr
- 1118 Timbervalley Ct
- 5435 Lariat Dr
- 5434 Lariat Dr
- 685 Ivyhill Dr
- 774 Ivyhill Dr
- 972 Hickoryview Dr
- 5907 Winners Cir
- 960 Hickoryview Dr
- 965 Hickoryview Dr
- 5912 Winners Cir
- 971 Hickoryview Dr
- 5901 Winners Cir
- 959 Hickoryview Dr
- 950 Hickoryview Dr
- 977 Hickoryview Dr
- 953 Hickoryview Dr
- 983 Hickoryview Dr
- 5932 Rapid Run Rd
- 990 Hickoryview Dr
- 5906 Winners Cir
- 5900 Winners Cir
- 5940 Rapid Run Rd
- 1129 Hickorylake Dr
- 5968 Rapid Run Rd
- 1133 Hickorylake Dr