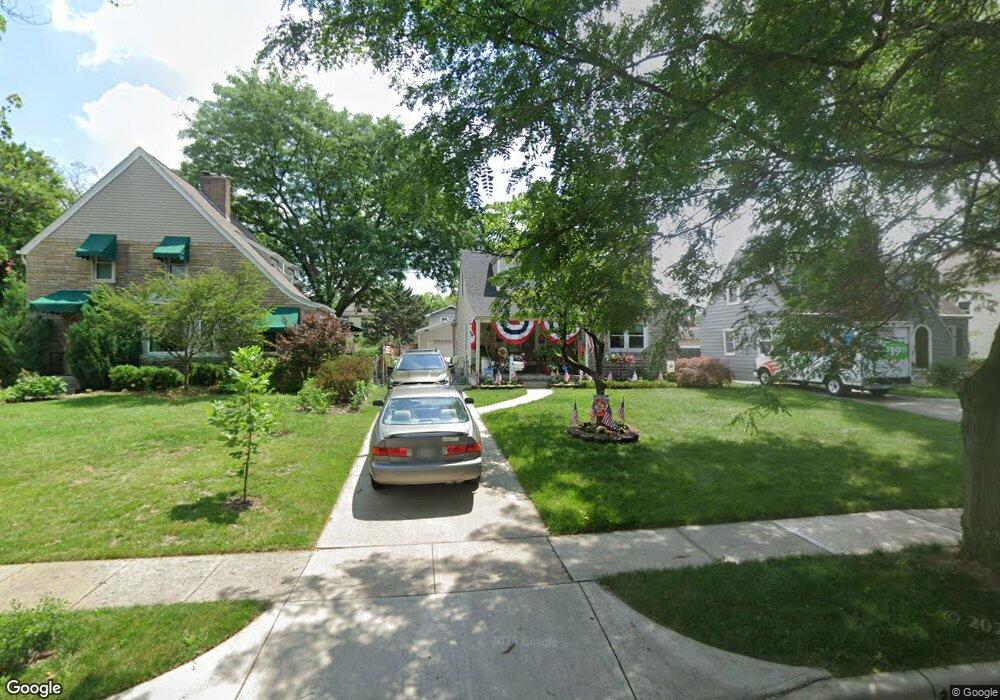
966 Montrose Ave Columbus, OH 43209
Estimated Value: $458,000 - $537,000
4
Beds
2
Baths
1,775
Sq Ft
$283/Sq Ft
Est. Value
About This Home
This home is located at 966 Montrose Ave, Columbus, OH 43209 and is currently estimated at $502,731, approximately $283 per square foot. 966 Montrose Ave is a home located in Franklin County with nearby schools including Montrose Elementary School, Bexley Middle School, and Bexley High School.
Ownership History
Date
Name
Owned For
Owner Type
Purchase Details
Closed on
Nov 3, 1995
Sold by
Cheryl G Menihardt
Bought by
Webb Donald J and Webb Ramona K
Current Estimated Value
Home Financials for this Owner
Home Financials are based on the most recent Mortgage that was taken out on this home.
Original Mortgage
$76,000
Outstanding Balance
$1,064
Interest Rate
7.61%
Mortgage Type
New Conventional
Estimated Equity
$501,667
Purchase Details
Closed on
May 12, 1988
Purchase Details
Closed on
Aug 1, 1983
Create a Home Valuation Report for This Property
The Home Valuation Report is an in-depth analysis detailing your home's value as well as a comparison with similar homes in the area
Home Values in the Area
Average Home Value in this Area
Purchase History
| Date | Buyer | Sale Price | Title Company |
|---|---|---|---|
| Webb Donald J | $118,450 | -- | |
| -- | -- | -- | |
| -- | $63,500 | -- |
Source: Public Records
Mortgage History
| Date | Status | Borrower | Loan Amount |
|---|---|---|---|
| Open | Webb Donald J | $76,000 |
Source: Public Records
Tax History Compared to Growth
Tax History
| Year | Tax Paid | Tax Assessment Tax Assessment Total Assessment is a certain percentage of the fair market value that is determined by local assessors to be the total taxable value of land and additions on the property. | Land | Improvement |
|---|---|---|---|---|
| 2024 | $7,168 | $129,080 | $43,470 | $85,610 |
| 2023 | $6,445 | $129,080 | $43,470 | $85,610 |
| 2022 | $6,689 | $107,600 | $24,820 | $82,780 |
| 2021 | $6,695 | $107,600 | $24,820 | $82,780 |
| 2020 | $6,636 | $107,600 | $24,820 | $82,780 |
| 2019 | $6,386 | $91,110 | $20,690 | $70,420 |
| 2018 | $5,057 | $91,110 | $20,690 | $70,420 |
| 2017 | $4,983 | $91,110 | $20,690 | $70,420 |
| 2016 | $4,551 | $69,970 | $16,840 | $53,130 |
| 2015 | $4,565 | $69,970 | $16,840 | $53,130 |
| 2014 | $4,591 | $69,970 | $16,840 | $53,130 |
| 2013 | $2,273 | $66,640 | $16,030 | $50,610 |
Source: Public Records
Map
Nearby Homes
- 905 Vernon Rd
- 891 Vernon Rd
- 1052 S Roosevelt Ave
- 895 Grandon Ave
- 782 S Remington Rd
- 945 Francis Ave
- 789 Chelsea Ave
- 843 Kenwick Rd
- 696 Vernon Rd
- 866-868 Sheridan Ave
- 2676 Tudor Rd
- 1205 Kenwick Rd
- 2530 Berwick Blvd
- 811 S Chesterfield Rd
- 2856 Eastminster Rd
- 2564 Sherwood Rd
- 563 S Dawson Ave
- 2424 Sherwood Rd
- 723-725 S Chesterfield Rd
- 2425 Bryden Rd
- 972 Montrose Ave
- 958 Montrose Ave
- 978 Montrose Ave
- 952 Montrose Ave
- 984 Montrose Ave
- 971 S Remington Rd
- 967 S Remington Rd
- 977 S Remington Rd
- 983 S Remington Rd
- 961 Montrose Ave
- 957 S Remington Rd
- 967 Montrose Ave
- 957 Montrose Ave
- 992 Montrose Ave
- 973 Montrose Ave
- 951 Montrose Ave
- 991 S Remington Rd
- 936 Montrose Ave
- 981 Montrose Ave
- 998 Montrose Ave