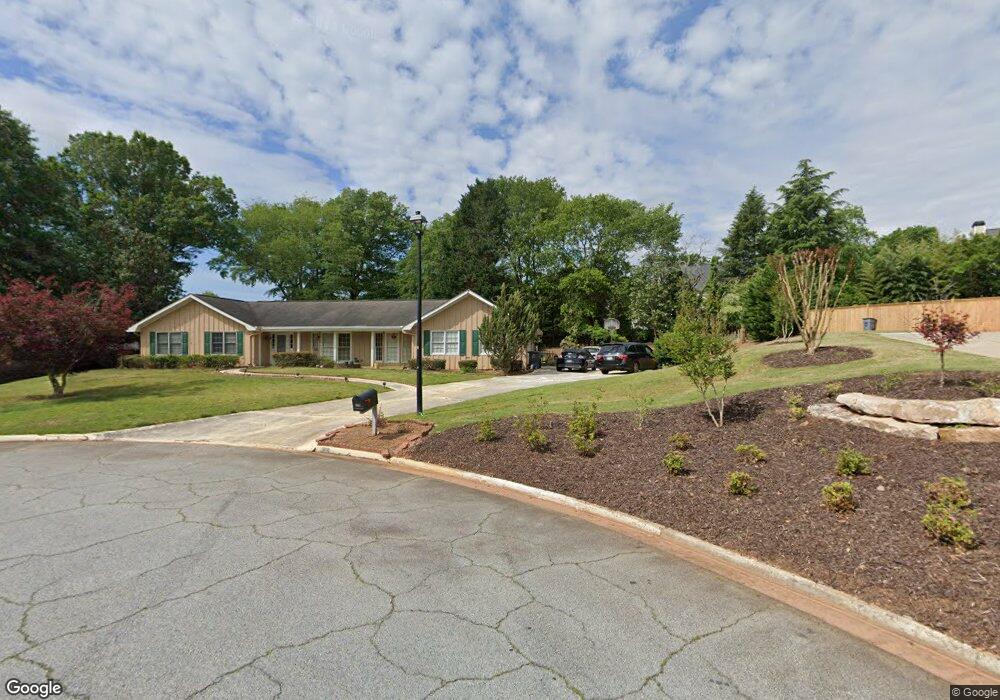
966 Par Ct Roswell, GA 30076
Estimated Value: $684,000 - $740,000
4
Beds
3
Baths
2,892
Sq Ft
$250/Sq Ft
Est. Value
About This Home
This home is located at 966 Par Ct, Roswell, GA 30076 and is currently estimated at $721,651, approximately $249 per square foot. 966 Par Ct is a home located in Fulton County with nearby schools including Vickery Mill Elementary, Elkins Pointe Middle School, and Fulton Academy of Science and Technology.
Ownership History
Date
Name
Owned For
Owner Type
Purchase Details
Closed on
Sep 21, 2005
Sold by
Brooks Thomas G and Brooks Florence B
Bought by
Arnett George T
Current Estimated Value
Home Financials for this Owner
Home Financials are based on the most recent Mortgage that was taken out on this home.
Original Mortgage
$191,920
Outstanding Balance
$98,776
Interest Rate
5.25%
Mortgage Type
New Conventional
Estimated Equity
$622,875
Purchase Details
Closed on
May 16, 1997
Sold by
Tabert Lawrence E and Tabert Janet
Bought by
Brooks Thomas G and Brooks Florence
Home Financials for this Owner
Home Financials are based on the most recent Mortgage that was taken out on this home.
Original Mortgage
$145,900
Interest Rate
7.98%
Mortgage Type
VA
Purchase Details
Closed on
Aug 30, 1996
Sold by
Baltes Elizabeth O
Bought by
Tabert Lawrence E Janet
Create a Home Valuation Report for This Property
The Home Valuation Report is an in-depth analysis detailing your home's value as well as a comparison with similar homes in the area
Home Values in the Area
Average Home Value in this Area
Purchase History
| Date | Buyer | Sale Price | Title Company |
|---|---|---|---|
| Arnett George T | $239,900 | -- | |
| Brooks Thomas G | $4,000 | -- | |
| Tabert Lawrence E Janet | $145,900 | -- |
Source: Public Records
Mortgage History
| Date | Status | Borrower | Loan Amount |
|---|---|---|---|
| Open | Arnett George T | $191,920 | |
| Previous Owner | Brooks Thomas G | $145,900 | |
| Closed | Tabert Lawrence E Janet | $0 |
Source: Public Records
Tax History Compared to Growth
Tax History
| Year | Tax Paid | Tax Assessment Tax Assessment Total Assessment is a certain percentage of the fair market value that is determined by local assessors to be the total taxable value of land and additions on the property. | Land | Improvement |
|---|---|---|---|---|
| 2025 | $598 | $235,640 | $92,120 | $143,520 |
| 2023 | $5,830 | $206,560 | $40,640 | $165,920 |
| 2022 | $2,390 | $161,680 | $41,120 | $120,560 |
| 2021 | $2,802 | $149,440 | $35,200 | $114,240 |
| 2020 | $2,851 | $142,280 | $33,520 | $108,760 |
| 2019 | $438 | $155,560 | $32,160 | $123,400 |
| 2018 | $3,322 | $138,320 | $43,320 | $95,000 |
| 2017 | $2,028 | $81,440 | $19,360 | $62,080 |
| 2016 | $2,026 | $81,440 | $19,360 | $62,080 |
| 2015 | $2,479 | $81,440 | $19,360 | $62,080 |
| 2014 | $2,106 | $81,440 | $19,360 | $62,080 |
Source: Public Records
Map
Nearby Homes
- 4025 Bellingrath Blvd
- 964 Par Ct
- 968 Par Ct
- 270 Bent Grass Dr
- 280 Bent Grass Dr
- 4035 Bellingrath Blvd
- 260 Bent Grass Dr
- 4015 Bellingrath Blvd
- 290 Bent Grass Dr
- 960 Windsor Trail
- 970 Windsor Trail
- 250 Bent Grass Dr
- 4005 Bellingrath Blvd
- 300 Bent Grass Dr Unit 2
- 4030 Bellingrath Blvd
- 985 Windsor Trail
- 275 Bent Grass Dr
- 240 Bent Grass Dr
- 285 Bent Grass Dr Unit 2
- 4020 Bellingrath Blvd