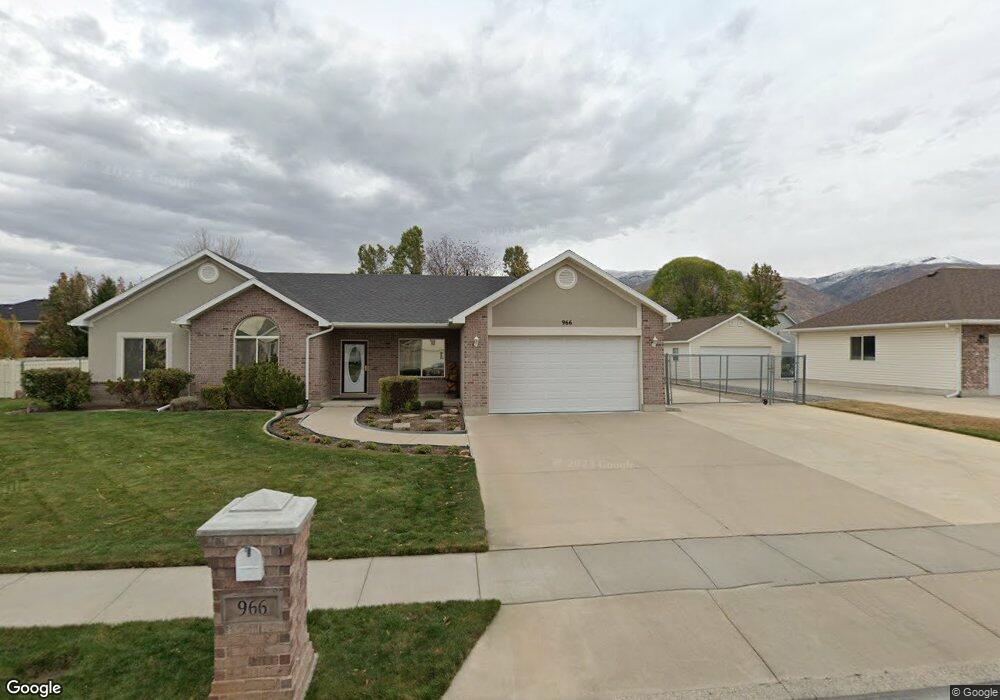
966 W 1700 N West Bountiful, UT 84087
Estimated Value: $582,000 - $627,000
3
Beds
2
Baths
1,765
Sq Ft
$338/Sq Ft
Est. Value
About This Home
This home is located at 966 W 1700 N, West Bountiful, UT 84087 and is currently estimated at $597,094, approximately $338 per square foot. 966 W 1700 N is a home located in Davis County with nearby schools including West Bountiful Elementary School, Bountiful Junior High School, and Viewmont High School.
Ownership History
Date
Name
Owned For
Owner Type
Purchase Details
Closed on
Apr 21, 2017
Sold by
Fike Thomas A and Fike Lori A
Bought by
Fike Trust and Thomas Andrew Fike
Current Estimated Value
Purchase Details
Closed on
Mar 7, 2014
Sold by
Fike Lori A
Bought by
Fike Thomas A and Fike Lori A
Purchase Details
Closed on
Sep 9, 1999
Sold by
Thomson Roy and Thomson Alma Lou
Bought by
Fike Lori A
Purchase Details
Closed on
Oct 17, 1996
Sold by
Sdc Wb Llc
Bought by
Thomson Roy and Thomson Alma Lou
Create a Home Valuation Report for This Property
The Home Valuation Report is an in-depth analysis detailing your home's value as well as a comparison with similar homes in the area
Home Values in the Area
Average Home Value in this Area
Purchase History
| Date | Buyer | Sale Price | Title Company |
|---|---|---|---|
| Fike Trust | -- | -- | |
| Fike Thomas A | -- | Aspen Title Insuranc | |
| Fike Lori A | -- | Bonneville Title Company | |
| Thomson Roy | -- | Associated Title Company |
Source: Public Records
Tax History Compared to Growth
Tax History
| Year | Tax Paid | Tax Assessment Tax Assessment Total Assessment is a certain percentage of the fair market value that is determined by local assessors to be the total taxable value of land and additions on the property. | Land | Improvement |
|---|---|---|---|---|
| 2025 | $3,451 | $295,350 | $147,948 | $147,402 |
| 2024 | $3,257 | $284,900 | $121,892 | $163,008 |
| 2023 | $3,116 | $499,000 | $228,952 | $270,048 |
| 2022 | $3,190 | $286,550 | $111,120 | $175,430 |
| 2021 | $2,875 | $395,000 | $152,343 | $242,657 |
| 2020 | $2,589 | $351,000 | $139,432 | $211,568 |
| 2019 | $2,588 | $348,000 | $139,176 | $208,824 |
| 2018 | $2,456 | $325,000 | $137,078 | $187,922 |
| 2016 | $2,185 | $157,080 | $38,140 | $118,940 |
| 2015 | $2,225 | $151,965 | $38,140 | $113,825 |
| 2014 | $2,045 | $142,580 | $38,140 | $104,440 |
| 2013 | -- | $118,145 | $45,949 | $72,196 |
Source: Public Records
Map
Nearby Homes