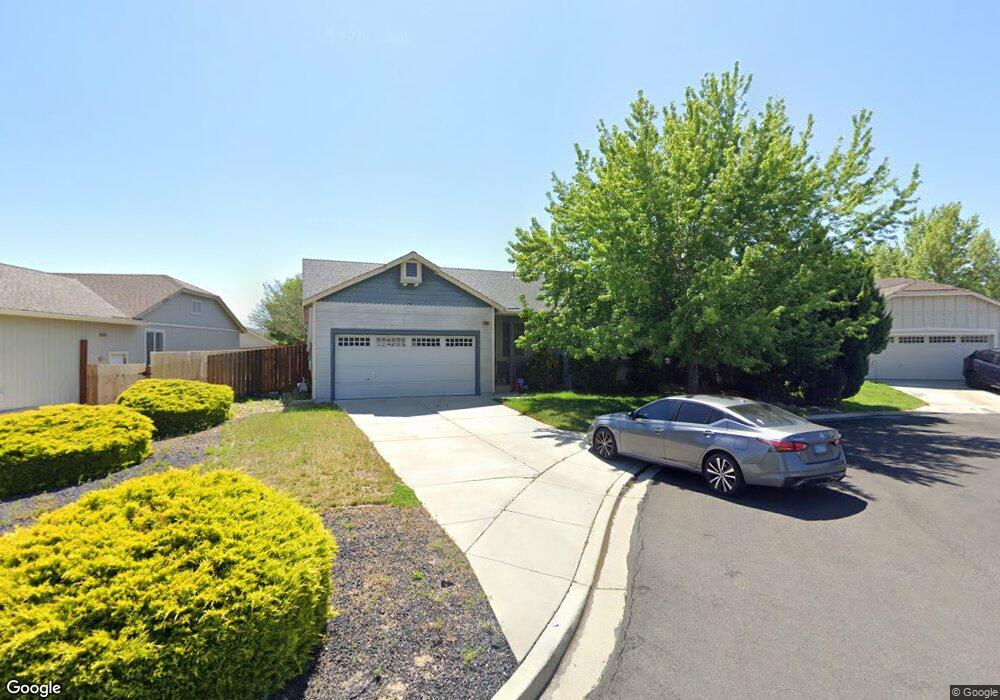
9660 Thornridge Ct Reno, NV 89506
Stead NeighborhoodEstimated Value: $422,211 - $430,000
3
Beds
2
Baths
1,292
Sq Ft
$331/Sq Ft
Est. Value
About This Home
This home is located at 9660 Thornridge Ct, Reno, NV 89506 and is currently estimated at $427,053, approximately $330 per square foot. 9660 Thornridge Ct is a home located in Washoe County with nearby schools including Stead Elementary School, William O'Brien Middle School, and North Valleys High School.
Ownership History
Date
Name
Owned For
Owner Type
Purchase Details
Closed on
Feb 2, 2011
Sold by
Etcheto Daniel G and Etcheto Cheryl
Bought by
Hunlock Frank and Hunlock Roslyn
Current Estimated Value
Purchase Details
Closed on
Oct 28, 2003
Sold by
Citadel Properties Inc
Bought by
Etcheto Daniel G and Etcheto Cheryl
Home Financials for this Owner
Home Financials are based on the most recent Mortgage that was taken out on this home.
Original Mortgage
$165,416
Interest Rate
4.24%
Mortgage Type
Unknown
Purchase Details
Closed on
Aug 21, 2003
Sold by
Adams Kris Alan and Adams Judy
Bought by
Steele Gary L
Purchase Details
Closed on
Sep 21, 2000
Sold by
Neuffer Homes & Development Inc
Bought by
Adams Kris Alan and Adams Judy
Home Financials for this Owner
Home Financials are based on the most recent Mortgage that was taken out on this home.
Original Mortgage
$139,563
Interest Rate
8.07%
Mortgage Type
VA
Create a Home Valuation Report for This Property
The Home Valuation Report is an in-depth analysis detailing your home's value as well as a comparison with similar homes in the area
Home Values in the Area
Average Home Value in this Area
Purchase History
| Date | Buyer | Sale Price | Title Company |
|---|---|---|---|
| Hunlock Frank | $110,000 | First American Title Reno | |
| Etcheto Daniel G | $502,933 | First American Title | |
| Citadel Properties Inc | -- | First American Title | |
| Steele Gary L | $143,700 | -- | |
| Adams Kris Alan | $137,000 | First American Title |
Source: Public Records
Mortgage History
| Date | Status | Borrower | Loan Amount |
|---|---|---|---|
| Previous Owner | Etcheto Daniel G | $165,416 | |
| Previous Owner | Adams Kris Alan | $139,563 |
Source: Public Records
Tax History Compared to Growth
Tax History
| Year | Tax Paid | Tax Assessment Tax Assessment Total Assessment is a certain percentage of the fair market value that is determined by local assessors to be the total taxable value of land and additions on the property. | Land | Improvement |
|---|---|---|---|---|
| 2025 | $2,042 | $84,028 | $31,640 | $52,388 |
| 2024 | $2,042 | $80,378 | $27,545 | $52,833 |
| 2023 | $1,891 | $79,681 | $29,610 | $50,071 |
| 2022 | $1,752 | $67,497 | $25,760 | $41,737 |
| 2021 | $1,624 | $62,294 | $20,650 | $41,644 |
| 2020 | $1,529 | $61,288 | $19,530 | $41,758 |
| 2019 | $1,455 | $59,643 | $19,215 | $40,428 |
| 2018 | $1,387 | $53,645 | $14,105 | $39,540 |
| 2017 | $1,333 | $52,701 | $13,125 | $39,576 |
| 2016 | $1,283 | $50,374 | $11,165 | $39,209 |
| 2015 | $1,282 | $49,122 | $9,940 | $39,182 |
| 2014 | $1,242 | $40,227 | $8,190 | $32,037 |
| 2013 | -- | $34,053 | $6,090 | $27,963 |
Source: Public Records
Map
Nearby Homes
- 9493 Long River Dr
- 9597 Long River Dr
- 9770 Brightridge Dr
- 9542 Angel Falls Dr
- 9599 Canyon Meadows Dr
- 11502 Andes St
- 11165 White Sage Dr
- 10005 Sagewood Dr
- 12120 Camel Rock Dr
- 12190 Rocky Mountain St
- 7800 Lazy Stream Dr
- 7800 Lazy Stream Dr Unit Lot 160
- 7812 Lazy Stream Dr Unit Lot 157
- 7824 Lazy Stream Dr Unit 154
- 11 Panamint Dr
- 7840 Lazy Stream Dr
- 7844 Lazy Stream Dr
- 12100 Himalaya St
- 7848 Lazy Stream Dr Unit 148
- 7848 Lazy Stream Dr
- 9690 Thornridge Ct
- 9630 Thornridge Ct
- 11635 Lone Desert Dr
- 11615 Lone Desert Dr
- 9600 Thornridge Ct
- 11655 Lone Desert Dr
- 9665 Thornridge Ct
- 11675 Lone Desert Dr
- 9685 Thornridge Ct
- 11595 Lone Desert Dr
- 9605 Thornridge Ct
- 11705 Lone Desert Dr
- 11755 Desert Bloom Dr
- 9645 Thornridge Ct
- 9625 Thornridge Ct
- 11735 Lone Desert Dr
- 11790 Desert Bloom Dr
- 11585 Lone Desert Dr
- 11745 Lone Desert Dr
- 11775 Desert Bloom Dr