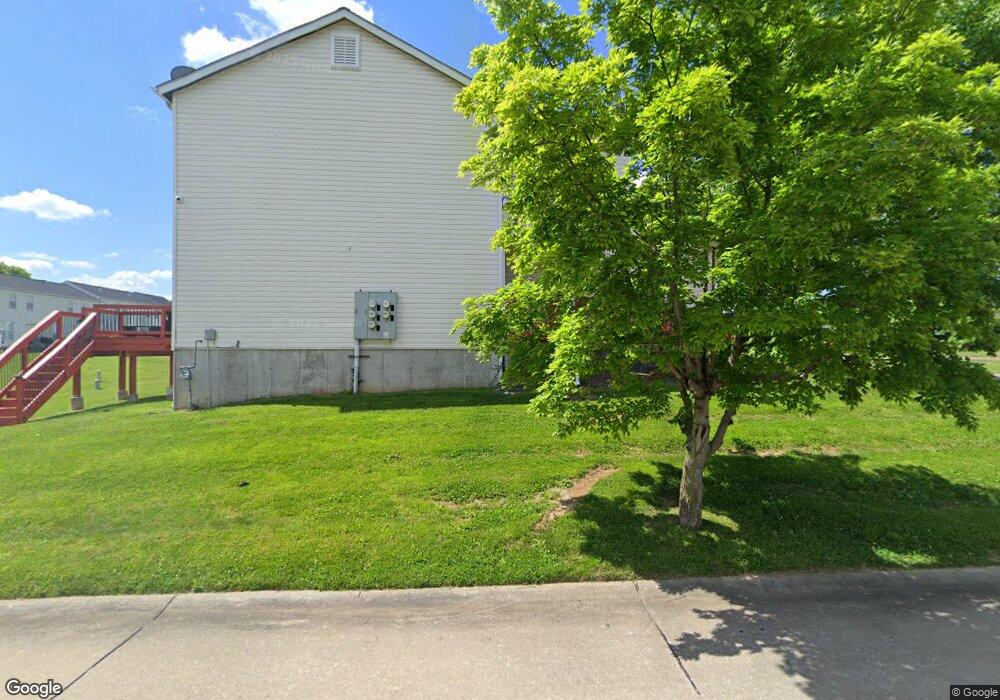
9666 Wilson Bridge Dr Saint Louis, MO 63136
Estimated Value: $131,000 - $175,000
3
Beds
3
Baths
1,400
Sq Ft
$112/Sq Ft
Est. Value
About This Home
This home is located at 9666 Wilson Bridge Dr, Saint Louis, MO 63136 and is currently estimated at $156,432, approximately $111 per square foot. 9666 Wilson Bridge Dr is a home located in St. Louis County with nearby schools including Jennings Junior High School, Jennings High School, and St. Louis Unified School.
Ownership History
Date
Name
Owned For
Owner Type
Purchase Details
Closed on
Nov 14, 2008
Sold by
Secretary Of Housing & Urban Development
Bought by
Finch Lakeshia E
Current Estimated Value
Home Financials for this Owner
Home Financials are based on the most recent Mortgage that was taken out on this home.
Original Mortgage
$133,754
Outstanding Balance
$89,602
Interest Rate
6.5%
Mortgage Type
FHA
Estimated Equity
$66,830
Purchase Details
Closed on
Jul 15, 2008
Sold by
Regions Bank
Bought by
Hud
Purchase Details
Closed on
Apr 4, 2008
Sold by
Bibbs Reginald K
Bought by
Regions Bank and Regions Mortgage Inc
Purchase Details
Closed on
Feb 24, 2006
Sold by
Taylor Morley Inc
Bought by
Bibbs Reginald K
Home Financials for this Owner
Home Financials are based on the most recent Mortgage that was taken out on this home.
Original Mortgage
$144,615
Interest Rate
6.05%
Mortgage Type
FHA
Create a Home Valuation Report for This Property
The Home Valuation Report is an in-depth analysis detailing your home's value as well as a comparison with similar homes in the area
Home Values in the Area
Average Home Value in this Area
Purchase History
| Date | Buyer | Sale Price | Title Company |
|---|---|---|---|
| Finch Lakeshia E | $120,000 | First American Title Ins Co | |
| Hud | -- | Ctc | |
| Regions Bank | $162,800 | None Available | |
| Bibbs Reginald K | $146,885 | None Available |
Source: Public Records
Mortgage History
| Date | Status | Borrower | Loan Amount |
|---|---|---|---|
| Open | Finch Lakeshia E | $133,754 | |
| Previous Owner | Bibbs Reginald K | $144,615 |
Source: Public Records
Tax History Compared to Growth
Tax History
| Year | Tax Paid | Tax Assessment Tax Assessment Total Assessment is a certain percentage of the fair market value that is determined by local assessors to be the total taxable value of land and additions on the property. | Land | Improvement |
|---|---|---|---|---|
| 2025 | $2,686 | $32,340 | $910 | $31,430 |
| 2024 | $2,686 | $25,480 | $910 | $24,570 |
| 2023 | $2,686 | $25,480 | $910 | $24,570 |
| 2022 | $2,929 | $22,840 | $610 | $22,230 |
| 2021 | $2,886 | $22,840 | $610 | $22,230 |
| 2020 | $3,018 | $22,710 | $1,520 | $21,190 |
| 2019 | $2,936 | $22,710 | $1,520 | $21,190 |
| 2018 | $2,808 | $20,790 | $1,220 | $19,570 |
| 2017 | $2,713 | $20,790 | $1,220 | $19,570 |
| 2016 | $3,313 | $25,330 | $1,520 | $23,810 |
| 2015 | $3,326 | $25,330 | $1,520 | $23,810 |
| 2014 | $2,942 | $22,320 | $4,860 | $17,460 |
Source: Public Records
Map
Nearby Homes
- 9456 Dawn Ct
- 9435 Eastchester Dr
- 9418 Pattonwood Dr
- 9213 Ranch Meadows Dr
- 9343 Duenke Dr
- 9422 Westchester Dr
- 9427 Yorktown Dr
- 9472 Yorktown Dr
- 9419 Jennings Station Rd
- 1119 Astoria Dr
- 1141 Saint Cyr Rd
- 1118 Dunford Dr
- 2568 Dorwood Dr
- 1236 Duenke Dr
- 1230 Yukon Dr
- 1109 Bluegrass Dr
- 9239 Astoria Dr
- 9271 Dell Ct
- 2367 Collett Dr
- 8912 Boyce Place
- 9662 Wilson Bridge Dr
- 9658 Wilson Bridge Dr
- 9654 Wilson Bridge Dr
- 9650 Wilson Bridge Dr
- 2550 Westfall Ln
- 2554 Westfall Ln
- 2525 Westfall Ln
- 2529 Westfall Ln
- 9642 Wilson Bridge Dr
- 2562 Westfall Ln
- 2558 Westfall Ln
- 2566 Westfall Ln
- 2533 Westfall Ln
- 9638 Wilson Bridge Dr
- 2537 Westfall Ln
- 2570 Westfall Ln
- 2574 Westfall Ln
- 2545 Westfall Ln
- 2541 Westfall Ln
- 9634 Wilson Bridge Dr