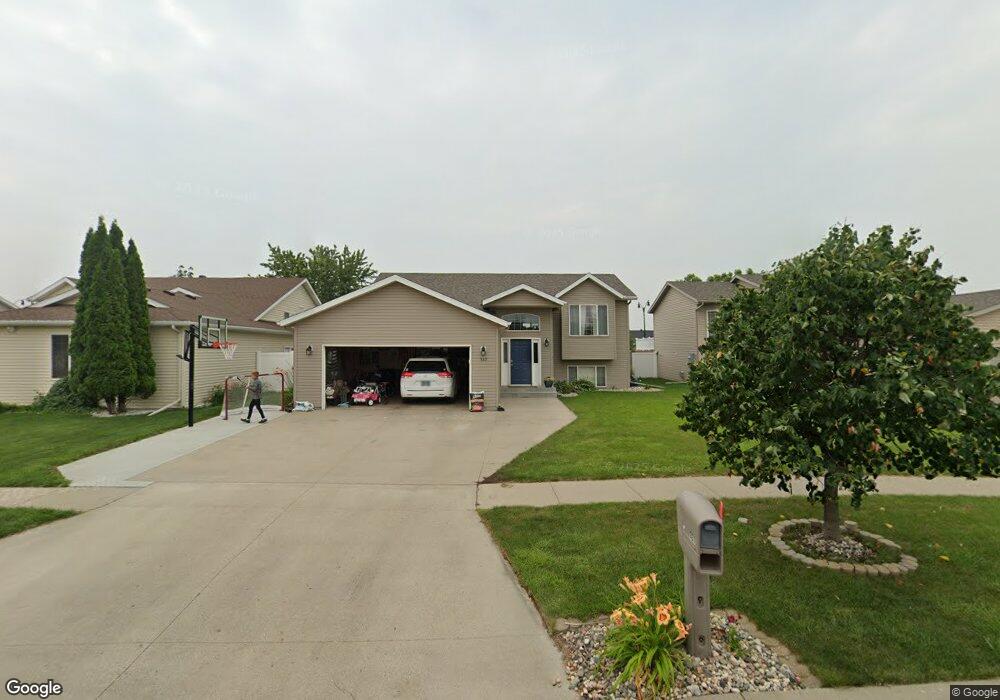
967 39 1 2 Ave W West Fargo, ND 58078
Eagle Run NeighborhoodEstimated Value: $320,000 - $344,000
4
Beds
2
Baths
2,102
Sq Ft
$157/Sq Ft
Est. Value
About This Home
This home is located at 967 39 1 2 Ave W, West Fargo, ND 58078 and is currently estimated at $330,686, approximately $157 per square foot. 967 39 1 2 Ave W is a home located in Cass County with nearby schools including Aurora Elementary School, Liberty Middle School, and West Fargo Sheyenne High School.
Ownership History
Date
Name
Owned For
Owner Type
Purchase Details
Closed on
Jun 8, 2016
Sold by
Brady Michael D and Brady Kellic A
Bought by
Temp Laura J and Temp Jacop A
Current Estimated Value
Purchase Details
Closed on
Nov 21, 2013
Sold by
Meyhoff Tate M and Meyhoff Cassandra A
Bought by
Brady Michael D
Home Financials for this Owner
Home Financials are based on the most recent Mortgage that was taken out on this home.
Original Mortgage
$182,631
Interest Rate
4.25%
Mortgage Type
FHA
Purchase Details
Closed on
Jun 7, 2010
Sold by
Reynolds Mica D
Bought by
Meyhoff Tate M and Mcdonald Cassandra A
Home Financials for this Owner
Home Financials are based on the most recent Mortgage that was taken out on this home.
Original Mortgage
$171,166
Interest Rate
5.5%
Mortgage Type
FHA
Create a Home Valuation Report for This Property
The Home Valuation Report is an in-depth analysis detailing your home's value as well as a comparison with similar homes in the area
Home Values in the Area
Average Home Value in this Area
Purchase History
| Date | Buyer | Sale Price | Title Company |
|---|---|---|---|
| Temp Laura J | -- | None Available | |
| Brady Michael D | $186,000 | Title Co | |
| Meyhoff Tate M | -- | -- |
Source: Public Records
Mortgage History
| Date | Status | Borrower | Loan Amount |
|---|---|---|---|
| Previous Owner | Brady Michael D | $182,631 | |
| Previous Owner | Meyhoff Tate M | $171,166 |
Source: Public Records
Tax History Compared to Growth
Tax History
| Year | Tax Paid | Tax Assessment Tax Assessment Total Assessment is a certain percentage of the fair market value that is determined by local assessors to be the total taxable value of land and additions on the property. | Land | Improvement |
|---|---|---|---|---|
| 2024 | $3,624 | $149,650 | $21,950 | $127,700 |
| 2023 | $3,997 | $144,800 | $21,950 | $122,850 |
| 2022 | $3,710 | $132,850 | $21,950 | $110,900 |
| 2021 | $3,473 | $124,000 | $17,550 | $106,450 |
| 2020 | $3,233 | $118,100 | $17,550 | $100,550 |
| 2019 | $3,183 | $115,350 | $17,550 | $97,800 |
| 2018 | $3,088 | $114,400 | $17,550 | $96,850 |
| 2017 | $3,069 | $115,450 | $17,550 | $97,900 |
| 2016 | $2,800 | $115,800 | $17,550 | $98,250 |
| 2015 | $2,799 | $92,300 | $9,300 | $83,000 |
| 2014 | $2,772 | $86,250 | $9,300 | $76,950 |
| 2013 | $2,666 | $81,900 | $9,300 | $72,600 |
Source: Public Records
Map
Nearby Homes
- 909 38 1 2 Ave W
- 1054 42nd Ave W
- 1040 39th Ave W
- 1156 42nd Ave W Unit A
- 1168 43rd Ave W
- 1236 S Beach Way
- 1381 Westport Beach Way
- 4507 Newport Ln
- 4509 11th St W
- 3662 N Sedona Ct
- 4534 Westport Pkwy
- 4717 11th St W
- 4757 11th St W
- 1089 Hickory Ln
- 1097 Hickory Ln
- 1082 Larkin Ln
- 974 50th Ave W
- 1052 50th Ave W
- 911 50th Ave W
- 951 50th Ave W
- 967 39 1/2 Ave W
- 961 39 1 2 Ave W
- 961 39 1/2 Ave W
- 973 39 1 2 Ave W
- 973 39 1/2 Ave W
- 955 39 1 2 Ave W
- 979 39 1 2 Ave W
- 955 39 1/2 Ave W
- 979 39 1/2 Ave W
- 949 39 1 2 Ave W
- 949 39 1/2 Ave W
- 985 39 1 2 Ave W
- 985 39 1/2 Ave W
- 968 39 1 2 Ave W
- 962 39 1 2 Ave W
- 968 39 1/2 Ave W
- 962 39 1/2 Ave W
- 974 39 1 2 Ave W
- 956 39 1/2 Ave W
- 956 39 1 2 Ave W