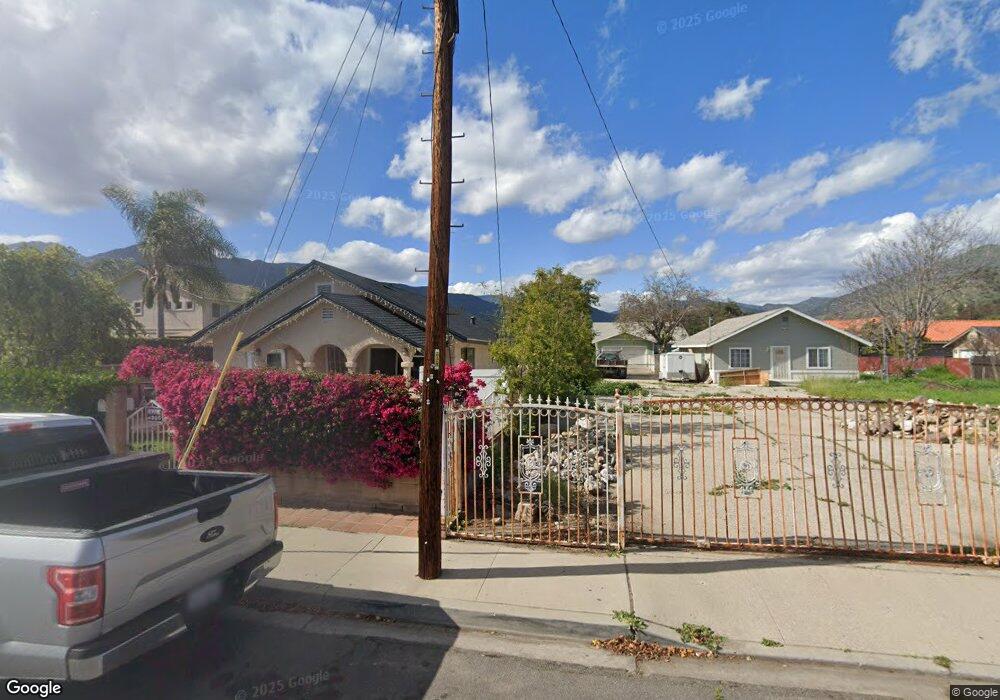
967 3rd St Fillmore, CA 93015
Estimated Value: $573,000 - $653,000
3
Beds
1
Bath
1,232
Sq Ft
$493/Sq Ft
Est. Value
About This Home
This home is located at 967 3rd St, Fillmore, CA 93015 and is currently estimated at $607,310, approximately $492 per square foot. 967 3rd St is a home located in Ventura County with nearby schools including Mountain Vista and Fillmore Senior High.
Ownership History
Date
Name
Owned For
Owner Type
Purchase Details
Closed on
Apr 18, 2025
Sold by
Soltero Karina
Bought by
Karina Soltero Living Trust and Soltero
Current Estimated Value
Purchase Details
Closed on
Oct 13, 2008
Sold by
Bank Of New York
Bought by
Soltero Karina
Home Financials for this Owner
Home Financials are based on the most recent Mortgage that was taken out on this home.
Original Mortgage
$172,720
Interest Rate
6.37%
Mortgage Type
FHA
Purchase Details
Closed on
Jul 8, 2008
Sold by
Vargas Gerardo E
Bought by
Bank Of New York
Purchase Details
Closed on
Apr 12, 2005
Sold by
Cortez Arturo Ayala and Cortez Maria Garcia
Bought by
Vargas Gerardo E
Home Financials for this Owner
Home Financials are based on the most recent Mortgage that was taken out on this home.
Original Mortgage
$89,200
Interest Rate
5.28%
Mortgage Type
Stand Alone Second
Create a Home Valuation Report for This Property
The Home Valuation Report is an in-depth analysis detailing your home's value as well as a comparison with similar homes in the area
Home Values in the Area
Average Home Value in this Area
Purchase History
| Date | Buyer | Sale Price | Title Company |
|---|---|---|---|
| Karina Soltero Living Trust | -- | None Listed On Document | |
| Soltero Karina | $175,000 | Landsafe Title Company | |
| Bank Of New York | $214,000 | Landsafe Title | |
| Vargas Gerardo E | $446,000 | First American Title Co |
Source: Public Records
Mortgage History
| Date | Status | Borrower | Loan Amount |
|---|---|---|---|
| Previous Owner | Soltero Karina | $172,720 | |
| Previous Owner | Vargas Gerardo E | $89,200 |
Source: Public Records
Tax History
| Year | Tax Paid | Tax Assessment Tax Assessment Total Assessment is a certain percentage of the fair market value that is determined by local assessors to be the total taxable value of land and additions on the property. | Land | Improvement |
|---|---|---|---|---|
| 2025 | $2,526 | $225,335 | $154,521 | $70,814 |
| 2024 | $2,526 | $220,917 | $151,491 | $69,426 |
| 2023 | $2,492 | $216,586 | $148,521 | $68,065 |
| 2022 | $2,306 | $212,340 | $145,609 | $66,731 |
| 2021 | $2,620 | $208,177 | $142,754 | $65,423 |
| 2020 | $2,352 | $206,045 | $141,292 | $64,753 |
| 2019 | $2,358 | $202,006 | $138,522 | $63,484 |
| 2018 | $2,310 | $198,046 | $135,806 | $62,240 |
| 2017 | $2,321 | $194,164 | $133,144 | $61,020 |
| 2016 | $2,149 | $190,358 | $130,534 | $59,824 |
| 2015 | $2,088 | $187,500 | $128,574 | $58,926 |
| 2014 | $2,086 | $183,829 | $126,056 | $57,773 |
Source: Public Records
Map
Nearby Homes
- 831 Blaine Ave
- 947 Meadowlark Dr
- 1120 1st St
- 1112 Mockingbird Ln
- 1143 Los Serenos Dr
- 815 Woodgrove Rd
- 809 Woodgrove Rd
- 320 D St
- 222 Village Square
- 553 Grapefruit Ln
- 202 Avon Ln
- 1163 W Ventura St
- 404 Central Ave
- 228 Parkhaven Ct
- 1000 Foothill Dr
- 300 Fillmore St
- 340 Central Ave
- 345 Blaine Ave
- 503 Arundell Cir
- 639 Mountain View St
Your Personal Tour Guide
Ask me questions while you tour the home.