Estimated Value: $415,000 - $470,000
3
Beds
4
Baths
1,772
Sq Ft
$248/Sq Ft
Est. Value
About This Home
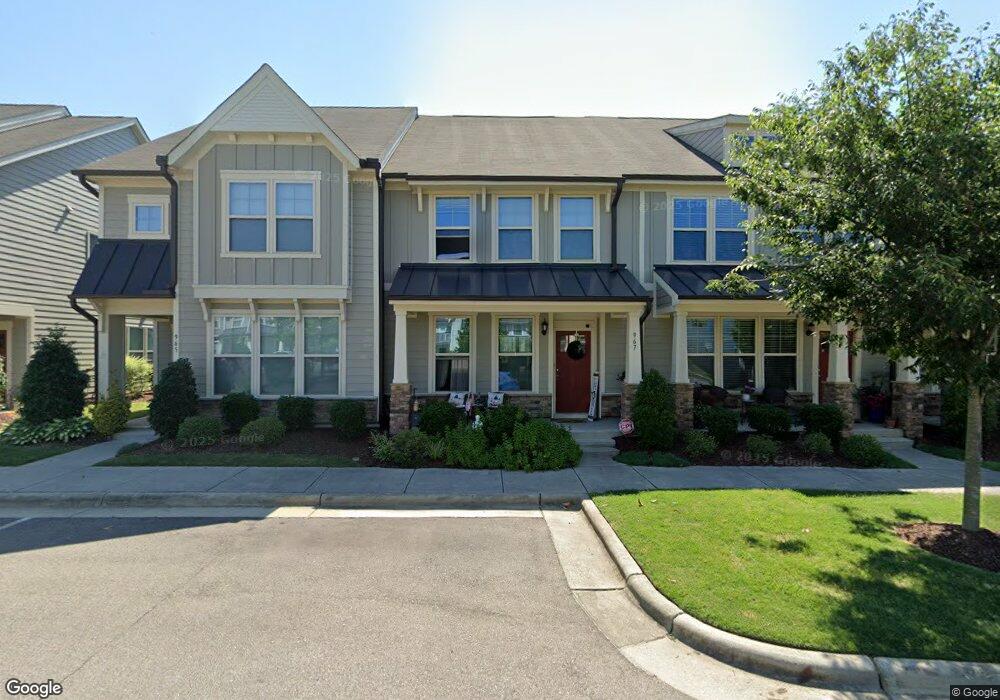
This home is located at 967 Ambergate Station, Apex, NC 27502 and is currently estimated at $440,292, approximately $248 per square foot. 967 Ambergate Station is a home located in Wake County with nearby schools including Salem Elementary, Salem Middle, and Apex High School.
Ownership History
Date
Name
Owned For
Owner Type
Purchase Details
Closed on
Jan 29, 2018
Sold by
Young Kelly B
Bought by
Young Kelly B and Kelly Young Revocable Trust
Current Estimated Value
Purchase Details
Closed on
Jan 13, 2018
Sold by
Young Kelly B
Bought by
Young Kelly B and Kelly Young Revocable Truyst
Purchase Details
Closed on
Jul 15, 2016
Sold by
Coastal Federal Credit Union
Bought by
Esaf Alfy and Fakho Christina
Home Financials for this Owner
Home Financials are based on the most recent Mortgage that was taken out on this home.
Original Mortgage
$170,000
Outstanding Balance
$135,007
Interest Rate
3.42%
Estimated Equity
$305,285
Purchase Details
Closed on
Jun 19, 2014
Sold by
Hhhunt Homes Raleigh Durham Llc
Bought by
Alfy Esaf N
Home Financials for this Owner
Home Financials are based on the most recent Mortgage that was taken out on this home.
Original Mortgage
$174,220
Interest Rate
4.28%
Mortgage Type
New Conventional
Create a Home Valuation Report for This Property
The Home Valuation Report is an in-depth analysis detailing your home's value as well as a comparison with similar homes in the area
Home Values in the Area
Average Home Value in this Area
Purchase History
| Date | Buyer | Sale Price | Title Company |
|---|---|---|---|
| Young Kelly B | -- | None Available | |
| Young Kelly B | -- | None Available | |
| Esaf Alfy | -- | -- | |
| Alfy Esaf N | $196,000 | None Available |
Source: Public Records
Mortgage History
| Date | Status | Borrower | Loan Amount |
|---|---|---|---|
| Open | Esaf Alfy | $170,000 | |
| Closed | Esaf Alfy | -- | |
| Previous Owner | Alfy Esaf N | $174,220 |
Source: Public Records
Tax History Compared to Growth
Tax History
| Year | Tax Paid | Tax Assessment Tax Assessment Total Assessment is a certain percentage of the fair market value that is determined by local assessors to be the total taxable value of land and additions on the property. | Land | Improvement |
|---|---|---|---|---|
| 2025 | $4,093 | $466,547 | $100,000 | $366,547 |
| 2024 | $4,002 | $466,547 | $100,000 | $366,547 |
| 2023 | $3,227 | $292,335 | $54,000 | $238,335 |
| 2022 | $3,030 | $292,335 | $54,000 | $238,335 |
| 2021 | $2,914 | $292,335 | $54,000 | $238,335 |
| 2020 | $2,885 | $292,335 | $54,000 | $238,335 |
| 2019 | $2,431 | $212,285 | $45,000 | $167,285 |
| 2018 | $2,290 | $212,285 | $45,000 | $167,285 |
| 2017 | $2,132 | $212,285 | $45,000 | $167,285 |
| 2016 | $2,101 | $212,285 | $45,000 | $167,285 |
| 2015 | $2,071 | $204,143 | $58,000 | $146,143 |
| 2014 | -- | $58,000 | $58,000 | $0 |
Source: Public Records
Map
Nearby Homes
- 953 Ambergate Station
- 919 Branch Line Ln
- 996 Tender Dr
- 1111 Platform Dr
- 1115 Platform Dr
- 1808 N Salem St
- 903 Norwood Ln
- 1003 Lathrop Ln
- 823 Richmont Grove Ln
- 810 Richmont Grove Ln
- 1000 Oakgate Ct
- 596 Grand Central Station
- 903 Dalton Ridge Place
- 904 Dalton Ridge Place
- 547 Grand Central Station
- 1002 Eastham Dr
- 4006 New Yarmouth Way
- 958 Bay Bouquet Ln
- 303 Knightsborough Way
- Weston End Unit Plan at Parc at Bradley Farm
- 969 Ambergate Station
- 965 Ambergate Station
- 971 Ambergate Station
- 961 Ambergate Station
- 973 Ambergate Station
- 959 Ambergate Station
- 977 Ambergate Station
- 957 Ambergate Station
- 981 Ambergate Station
- 955 Ambergate Station
- 974 Shoofly Path
- 972 Shoofly Path
- 985 Ambergate Station
- 962 Shoofly Path
- 978 Shoofly Path
- 960 Shoofly Path
- 980 Shoofly Path
- 951 Ambergate Station
- 986 Shoofly Path
- 984 Shoofly Path