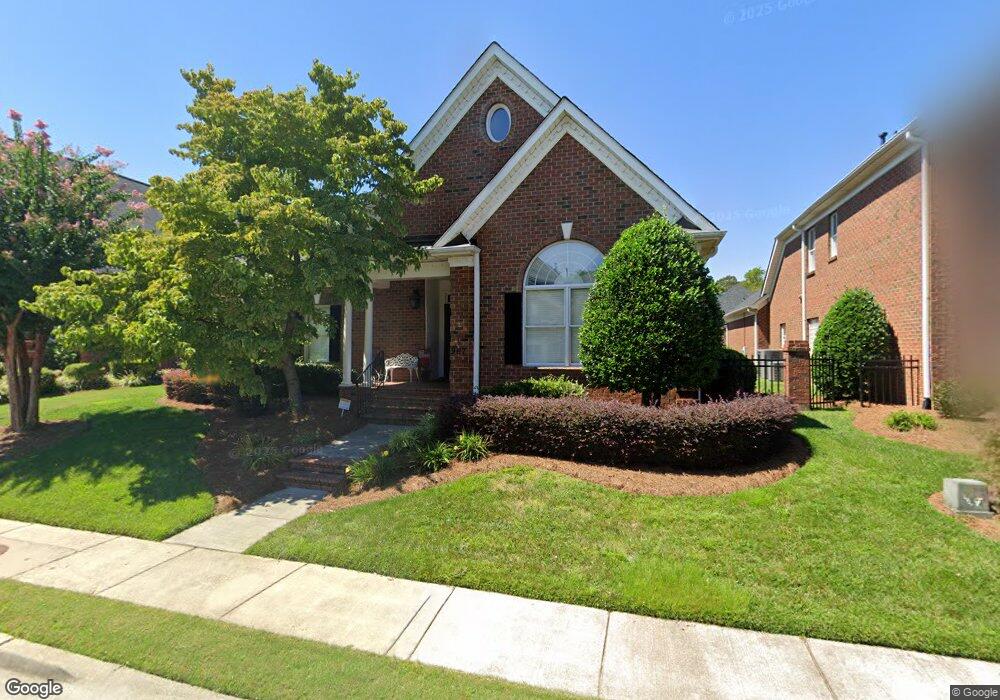
967 Blakeley Walk Rock Hill, SC 29732
Estimated Value: $480,162 - $580,000
--
Bed
--
Bath
1,853
Sq Ft
$277/Sq Ft
Est. Value
About This Home
This home is located at 967 Blakeley Walk, Rock Hill, SC 29732 and is currently estimated at $513,041, approximately $276 per square foot. 967 Blakeley Walk is a home with nearby schools including India Hook Elementary School, Dutchman Creek Middle School, and Rock Hill High School.
Ownership History
Date
Name
Owned For
Owner Type
Purchase Details
Closed on
Feb 29, 2008
Sold by
Wyatt James M and Wyatt Joyce C
Bought by
Helms Gloria J
Current Estimated Value
Home Financials for this Owner
Home Financials are based on the most recent Mortgage that was taken out on this home.
Original Mortgage
$240,000
Outstanding Balance
$148,632
Interest Rate
5.63%
Mortgage Type
New Conventional
Estimated Equity
$364,409
Purchase Details
Closed on
Aug 31, 2005
Sold by
Payne Thomas A
Bought by
Wyatt James M and Wyatt Joyce C
Home Financials for this Owner
Home Financials are based on the most recent Mortgage that was taken out on this home.
Original Mortgage
$52,000
Interest Rate
5.77%
Mortgage Type
Stand Alone Second
Purchase Details
Closed on
Jul 16, 2001
Sold by
The Oconnell Corp
Bought by
Payne Thomas A
Purchase Details
Closed on
Sep 20, 1999
Sold by
Laurel Creek Llc
Bought by
The Oconnell Corp
Create a Home Valuation Report for This Property
The Home Valuation Report is an in-depth analysis detailing your home's value as well as a comparison with similar homes in the area
Home Values in the Area
Average Home Value in this Area
Purchase History
| Date | Buyer | Sale Price | Title Company |
|---|---|---|---|
| Helms Gloria J | $300,000 | Attorney | |
| Wyatt James M | $260,000 | -- | |
| Payne Thomas A | $240,000 | -- | |
| The Oconnell Corp | $32,000 | -- |
Source: Public Records
Mortgage History
| Date | Status | Borrower | Loan Amount |
|---|---|---|---|
| Open | Helms Gloria J | $240,000 | |
| Previous Owner | Wyatt James M | $52,000 | |
| Previous Owner | Wyatt James M | $208,000 |
Source: Public Records
Tax History Compared to Growth
Tax History
| Year | Tax Paid | Tax Assessment Tax Assessment Total Assessment is a certain percentage of the fair market value that is determined by local assessors to be the total taxable value of land and additions on the property. | Land | Improvement |
|---|---|---|---|---|
| 2024 | $1,882 | $10,580 | $2,278 | $8,302 |
| 2023 | $1,888 | $10,580 | $2,279 | $8,301 |
| 2022 | $1,900 | $10,580 | $2,279 | $8,301 |
| 2021 | -- | $10,580 | $2,279 | $8,301 |
| 2020 | $1,905 | $10,580 | $0 | $0 |
| 2019 | $1,649 | $9,200 | $0 | $0 |
| 2018 | $1,647 | $9,200 | $0 | $0 |
| 2017 | $1,586 | $9,200 | $0 | $0 |
| 2016 | $1,572 | $9,200 | $0 | $0 |
| 2014 | $2,163 | $9,200 | $2,200 | $7,000 |
| 2013 | $2,163 | $10,400 | $2,200 | $8,200 |
Source: Public Records
Map
Nearby Homes
- 971 Blakeley Walk
- 962 Blakeley Walk
- 3110 India Hook Rd
- 1116 Torrington Cir
- 2733 Harlinsdale Dr
- 2832 Forest Hills Cir
- 3708 Celanese Rd
- 2972 Kaneland Ct
- 2300 Crosstrail Ridge
- 2971 Kaneland Ct
- 630 Deberry Hollow
- 800 Warrington Place
- 2177 Lookout Ridge
- 2981 Ellington Dr
- 2296 Blue Ridge Way
- 3124 India Hook Rd
- 2405 Falling Leaf Ct
- 2065 Hightower Rd
- 2229 Rosewood Dr
- 1845 Matthews Dr
- 963 Blakeley Walk
- 959 Blakeley Walk
- 4120 Barton Ln
- 4116 Barton Ln
- 970 Blakeley Walk
- 966 Blakeley Walk
- 4112 Barton Ln
- 990 Blakeley Walk
- 974 Blakeley Walk
- 986 Blakeley Walk
- 955 Blakeley Walk
- 4108 Barton Ln
- 998 Blakeley Walk
- 978 Blakeley Walk
- 958 Blakeley Walk
- 4104 Barton Ln
- 1002 Blakeley Walk
- 982 Blakeley Walk
- 954 Blakeley Walk
- 4109 Barton Ln