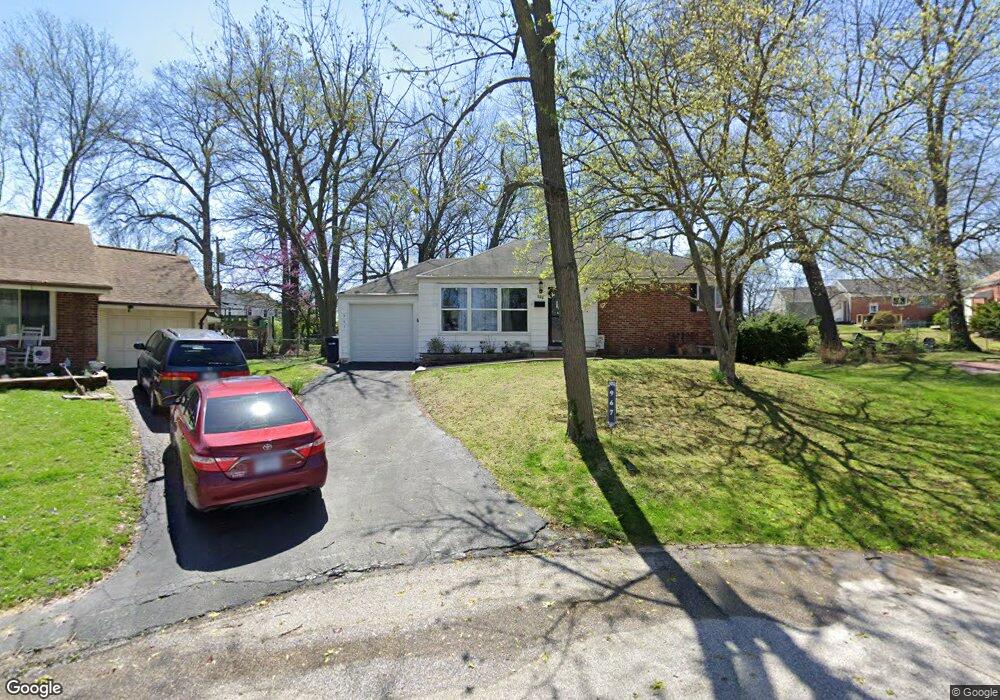
967 Diane Ln Saint Louis, MO 63126
Estimated Value: $233,055 - $250,000
2
Beds
1
Bath
864
Sq Ft
$282/Sq Ft
Est. Value
About This Home
This home is located at 967 Diane Ln, Saint Louis, MO 63126 and is currently estimated at $243,264, approximately $281 per square foot. 967 Diane Ln is a home located in St. Louis County with nearby schools including Crestwood Elementary School, Truman Middle School, and Lindbergh High School.
Ownership History
Date
Name
Owned For
Owner Type
Purchase Details
Closed on
Oct 16, 2009
Sold by
Bodendieck Loren G and Bodendieck Christine A
Bought by
Moore Amy L
Current Estimated Value
Home Financials for this Owner
Home Financials are based on the most recent Mortgage that was taken out on this home.
Original Mortgage
$135,500
Outstanding Balance
$88,344
Interest Rate
5.05%
Mortgage Type
FHA
Estimated Equity
$154,920
Purchase Details
Closed on
Jun 5, 2002
Sold by
Ridgemoor Properties Inc
Bought by
Bodendieck Loren G and Bodendieck Christine A
Home Financials for this Owner
Home Financials are based on the most recent Mortgage that was taken out on this home.
Original Mortgage
$98,100
Interest Rate
6.6%
Purchase Details
Closed on
May 1, 2002
Sold by
Martin Elizabeth Ann
Bought by
Ridgemoor Properties Inc
Home Financials for this Owner
Home Financials are based on the most recent Mortgage that was taken out on this home.
Original Mortgage
$98,100
Interest Rate
6.6%
Create a Home Valuation Report for This Property
The Home Valuation Report is an in-depth analysis detailing your home's value as well as a comparison with similar homes in the area
Home Values in the Area
Average Home Value in this Area
Purchase History
| Date | Buyer | Sale Price | Title Company |
|---|---|---|---|
| Moore Amy L | $138,000 | Assured Title Company | |
| Bodendieck Loren G | $109,000 | -- | |
| Ridgemoor Properties Inc | $97,000 | -- |
Source: Public Records
Mortgage History
| Date | Status | Borrower | Loan Amount |
|---|---|---|---|
| Open | Moore Amy L | $135,500 | |
| Previous Owner | Bodendieck Loren G | $98,100 | |
| Previous Owner | Ridgemoor Properties Inc | $112,900 |
Source: Public Records
Tax History Compared to Growth
Tax History
| Year | Tax Paid | Tax Assessment Tax Assessment Total Assessment is a certain percentage of the fair market value that is determined by local assessors to be the total taxable value of land and additions on the property. | Land | Improvement |
|---|---|---|---|---|
| 2025 | $2,330 | $41,440 | $21,090 | $20,350 |
| 2024 | $2,330 | $33,370 | $13,550 | $19,820 |
| 2023 | $2,154 | $33,370 | $13,550 | $19,820 |
| 2022 | $2,247 | $31,030 | $15,050 | $15,980 |
| 2021 | $2,049 | $31,030 | $15,050 | $15,980 |
| 2020 | $1,976 | $28,850 | $13,550 | $15,300 |
| 2019 | $1,971 | $28,850 | $13,550 | $15,300 |
| 2018 | $1,826 | $24,200 | $8,700 | $15,500 |
| 2017 | $1,806 | $24,200 | $8,700 | $15,500 |
| 2016 | $1,625 | $22,020 | $7,750 | $14,270 |
| 2015 | $1,634 | $22,020 | $7,750 | $14,270 |
| 2014 | -- | $19,320 | $4,710 | $14,610 |
Source: Public Records
Map
Nearby Homes
- 1048 Diversey Dr
- 9810 Big Bend Blvd
- 649 S Sappington Rd
- 815 Sanders Dr
- 0 Unknown Unit MIS25067424
- 11 Melshire Ct
- 631 Clover Ln
- 640 Clover Ln
- 9609 Twincrest Dr
- 432 S Sappington Rd
- 9608 Greenview Dr
- 614 Conover Ln
- 745 Montego Dr
- 1353 Webster Path Dr
- 127 Webster Woods Dr
- 1543 Fournier Dr
- 1120 Tahiti Dr
- 9405 Vandervoort Ct
- 1637 Ridgewood Dr
- 503 Acorn Dr