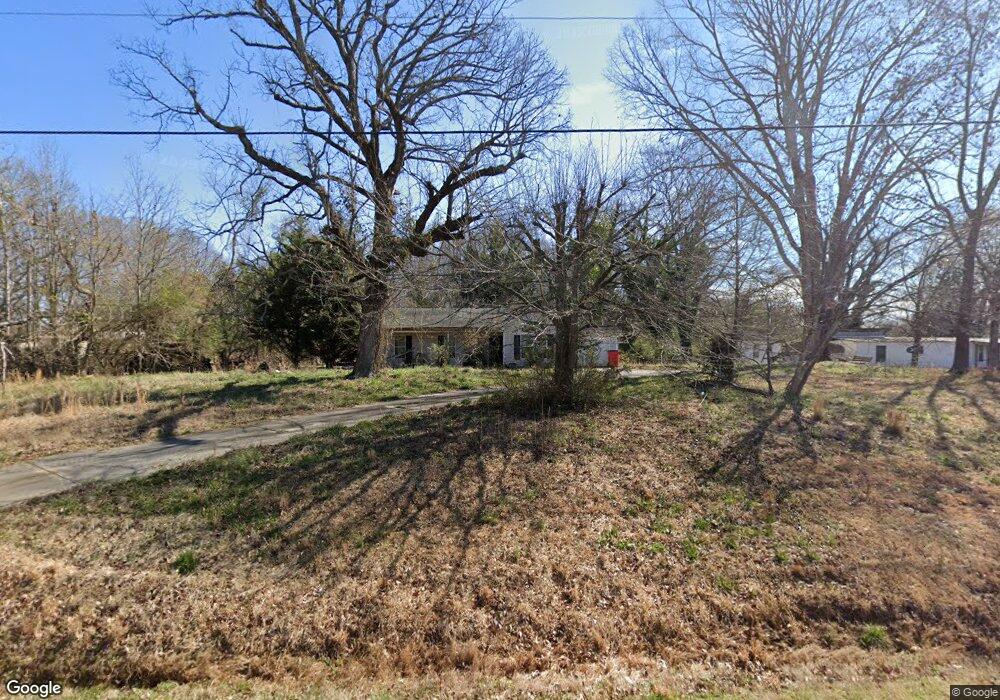
967 Highway 82 S Jefferson, GA 30549
Estimated Value: $189,000 - $256,000
3
Beds
2
Baths
1,090
Sq Ft
$213/Sq Ft
Est. Value
About This Home
This home is located at 967 Highway 82 S, Jefferson, GA 30549 and is currently estimated at $231,746, approximately $212 per square foot. 967 Highway 82 S is a home located in Jackson County with nearby schools including South Jackson Elementary School, East Jackson Middle School, and East Jackson Comprehensive High School.
Ownership History
Date
Name
Owned For
Owner Type
Purchase Details
Closed on
Dec 27, 2010
Sold by
Federal Home Loan Mortgage Corporation
Bought by
Payne Kevin
Current Estimated Value
Home Financials for this Owner
Home Financials are based on the most recent Mortgage that was taken out on this home.
Original Mortgage
$56,610
Outstanding Balance
$38,760
Interest Rate
4.87%
Mortgage Type
FHA
Estimated Equity
$192,986
Purchase Details
Closed on
Jun 1, 2010
Sold by
Pinkston David N
Bought by
Chase Home Finance Llc
Purchase Details
Closed on
Aug 29, 2005
Sold by
Adams Debra Lynn
Bought by
Pinkston David N and Pinkston Dusty M
Purchase Details
Closed on
Sep 26, 2002
Sold by
Adams Warren M
Bought by
Adams Debra Lynn
Purchase Details
Closed on
Oct 28, 1997
Bought by
Adams Warren M
Create a Home Valuation Report for This Property
The Home Valuation Report is an in-depth analysis detailing your home's value as well as a comparison with similar homes in the area
Home Values in the Area
Average Home Value in this Area
Purchase History
| Date | Buyer | Sale Price | Title Company |
|---|---|---|---|
| Payne Kevin | $59,000 | -- | |
| Chase Home Finance Llc | $88,801 | -- | |
| Federal Home Loan Mortgage Corporation | $88,801 | -- | |
| Pinkston David N | $24,000 | -- | |
| Adams Debra Lynn | -- | -- | |
| Adams Warren M | -- | -- |
Source: Public Records
Mortgage History
| Date | Status | Borrower | Loan Amount |
|---|---|---|---|
| Open | Federal Home Loan Mortgage Corporation | $56,610 |
Source: Public Records
Tax History Compared to Growth
Tax History
| Year | Tax Paid | Tax Assessment Tax Assessment Total Assessment is a certain percentage of the fair market value that is determined by local assessors to be the total taxable value of land and additions on the property. | Land | Improvement |
|---|---|---|---|---|
| 2024 | $1,582 | $64,328 | $14,480 | $49,848 |
| 2023 | $1,576 | $59,088 | $14,480 | $44,608 |
| 2022 | $1,132 | $41,248 | $4,920 | $36,328 |
| 2021 | $1,140 | $41,248 | $4,920 | $36,328 |
| 2020 | $1,052 | $35,048 | $4,920 | $30,128 |
| 2019 | $1,068 | $35,048 | $4,920 | $30,128 |
| 2018 | $1,069 | $34,600 | $4,920 | $29,680 |
| 2017 | $1,013 | $32,653 | $4,681 | $27,972 |
| 2016 | $1,019 | $32,653 | $4,681 | $27,972 |
| 2015 | $1,024 | $32,653 | $4,681 | $27,972 |
| 2014 | $878 | $28,082 | $4,681 | $23,400 |
| 2013 | -- | $27,736 | $4,336 | $23,400 |
Source: Public Records
Map
Nearby Homes
- 37 Carruth Rd
- 77 Lakeview Ct
- 0 Berch Tree Trail Unit LOT 12
- 0 Berch Tree Trail Unit LOT 7
- 0 Berch Tree Trail Unit 7665580
- 0 Berch Tree Trail Unit 7665573
- 139 Anglin Rd
- 144 Briar Rose Blvd
- 194 Adams Rd
- 269 Rock Forge Ln
- 1094 B Whitfield Rd
- 00 Johnson Mill Rd
- 0 Johnson Mill Rd Unit 10556550
- 474 Davis Rd
- 570 Davis Rd
- 538 Davis Rd
- 604 Davis Rd
- 22 Creek Side Ct
- 1268 Johnson Mill Rd
- 1003 Johnson Mill Rd
- 999 Highway 82 S
- 996 Highway 82 S
- 980 Highway 82 S
- 1042 Highway 82 S
- 875 Highway 82 S
- 99 Carruth Rd Unit 7
- 99 Carruth Rd
- 137 Carruth Rd
- 205 Carruth Rd
- 175 Carruth Rd
- 823 Highway 82 S
- 1068 Highway 82 S
- 225 Carruth Rd
- 0 Old Forge Ln Unit LOT 37 3233361
- 0 Old Forge Ln Unit 29J 2942548
- 0 Old Forge Ln Unit 7014425
- 0 Old Forge Ln Unit 7145882
- 0 Old Forge Ln Unit LOT 37 7156414
- 0 Old Forge Ln Unit 19 7165729
- 0 Old Forge Ln Unit J-14 7196628