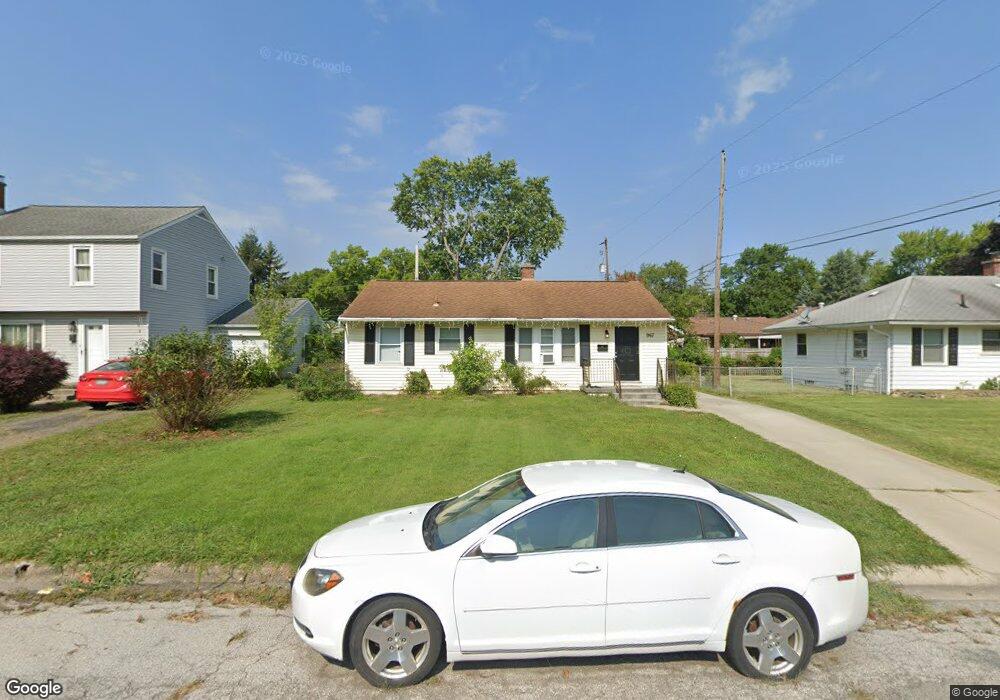
967 S Richardson Ave Columbus, OH 43204
Brookshire NeighborhoodEstimated Value: $182,000 - $199,000
3
Beds
1
Bath
912
Sq Ft
$205/Sq Ft
Est. Value
About This Home
This home is located at 967 S Richardson Ave, Columbus, OH 43204 and is currently estimated at $186,642, approximately $204 per square foot. 967 S Richardson Ave is a home located in Franklin County with nearby schools including Lindbergh Elementary School, Hilltonia Middle School, and Briggs High School.
Ownership History
Date
Name
Owned For
Owner Type
Purchase Details
Closed on
Sep 18, 2024
Sold by
Rstk Columbus Owner 1 Lp
Bought by
Star Borrower Sfr4 Lp
Current Estimated Value
Home Financials for this Owner
Home Financials are based on the most recent Mortgage that was taken out on this home.
Original Mortgage
$471,594,000
Outstanding Balance
$466,282,745
Interest Rate
6.46%
Mortgage Type
Credit Line Revolving
Estimated Equity
-$466,096,103
Purchase Details
Closed on
Apr 8, 2022
Sold by
Saven Chim
Bought by
Rstk Columbus Owner 1 Lp
Purchase Details
Closed on
Apr 5, 2022
Sold by
Frank Bennici
Bought by
Chim Saven
Purchase Details
Closed on
Jul 5, 2007
Sold by
Bennici Sensovann S and Son Sensovann
Bought by
Chim Saven
Purchase Details
Closed on
Dec 20, 1989
Bought by
Som Sensovann
Create a Home Valuation Report for This Property
The Home Valuation Report is an in-depth analysis detailing your home's value as well as a comparison with similar homes in the area
Home Values in the Area
Average Home Value in this Area
Purchase History
| Date | Buyer | Sale Price | Title Company |
|---|---|---|---|
| Star Borrower Sfr4 Lp | -- | Os National | |
| Star Borrower Sfr4 Lp | -- | Os National | |
| Rstk Columbus Owner 1 Lp | $155,000 | First American Title | |
| Chim Saven | -- | First American Title | |
| Chim Saven | $55,500 | None Available | |
| Som Sensovann | $56,500 | -- |
Source: Public Records
Mortgage History
| Date | Status | Borrower | Loan Amount |
|---|---|---|---|
| Open | Star Borrower Sfr4 Lp | $471,594,000 | |
| Closed | Star Borrower Sfr4 Lp | $471,594,000 |
Source: Public Records
Tax History Compared to Growth
Tax History
| Year | Tax Paid | Tax Assessment Tax Assessment Total Assessment is a certain percentage of the fair market value that is determined by local assessors to be the total taxable value of land and additions on the property. | Land | Improvement |
|---|---|---|---|---|
| 2024 | $2,433 | $53,100 | $12,500 | $40,600 |
| 2023 | $2,553 | $53,100 | $12,500 | $40,600 |
| 2022 | $1,785 | $34,410 | $5,460 | $28,950 |
| 2021 | $1,788 | $34,410 | $5,460 | $28,950 |
| 2020 | $1,790 | $34,410 | $5,460 | $28,950 |
| 2019 | $1,745 | $28,770 | $4,550 | $24,220 |
| 2018 | $1,485 | $28,770 | $4,550 | $24,220 |
| 2017 | $1,549 | $28,770 | $4,550 | $24,220 |
| 2016 | $1,354 | $20,440 | $4,340 | $16,100 |
| 2015 | $1,229 | $20,440 | $4,340 | $16,100 |
| 2014 | $1,232 | $20,440 | $4,340 | $16,100 |
| 2013 | $759 | $24,045 | $5,110 | $18,935 |
Source: Public Records
Map
Nearby Homes
- 975 Hodges Dr
- 2588 Regina Ave
- 2610 Spaatz Ave
- 2681 Vanderberg Ave
- 2743 Saint Joseph Ave
- 2687 Vanderberg Ave
- 2743 Bernadette Rd
- 2585 Eakin Rd
- 2579 Eakin Rd
- 1060 Saint Agnes Ave
- 2538 Vanderberg Ave
- 2530 Vanderberg Ave
- 2783-2785 Vanderberg Ave
- 811 S Richardson Ave
- 805 S Warren Ave
- 790 Racine Ave
- 2547 Rosedale Ave
- 903 S Harris Ave
- 730 S Burgess Ave
- 734 S Richardson Ave
- 975 S Richardson Ave
- 951 S Richardson Ave
- 2659 Regina Ave
- 981 S Richardson Ave
- 2675 Saint Patrick Rd
- 2667 Saint Patrick Rd
- 2687 Saint Patrick Rd
- 0 S Richardson Ave
- 970 S Richardson Ave
- 964 S Richardson Ave
- 976 S Richardson Ave
- 991 S Richardson Ave
- 984 S Richardson Ave
- 956 S Richardson Ave
- 939 S Richardson Ave
- 990 S Richardson Ave
- 2660 Regina Ave
- 2676 Saint Joseph Ave
- 996 S Richardson Ave
- 2690 Saint Patrick Rd