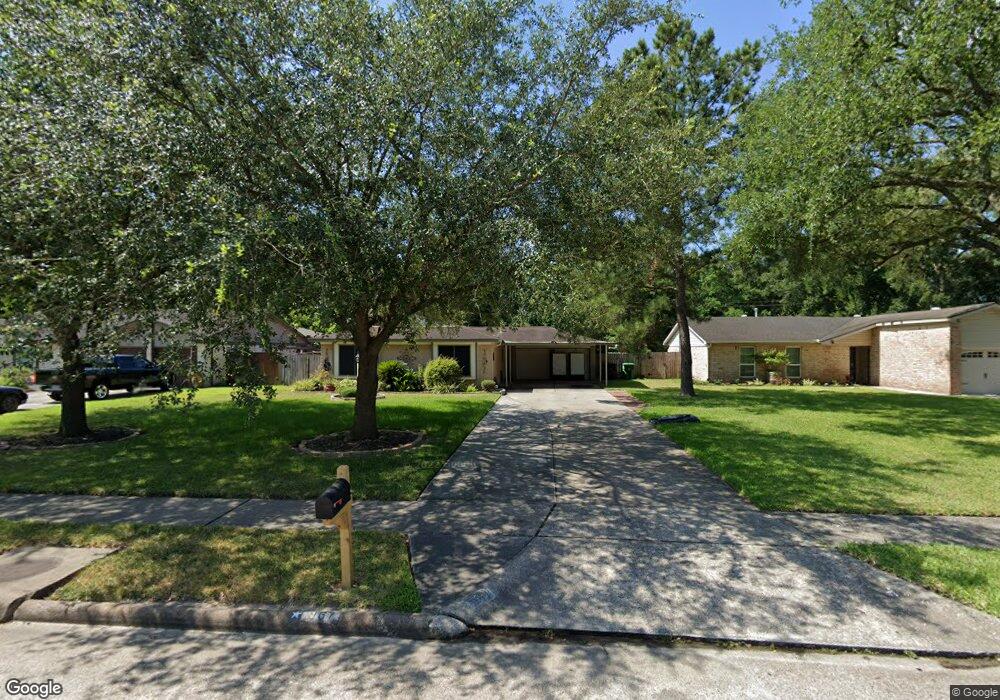
967 W Bertrand St Houston, TX 77088
Hidden Valley NeighborhoodEstimated Value: $245,000 - $273,000
3
Beds
2
Baths
1,758
Sq Ft
$145/Sq Ft
Est. Value
About This Home
This home is located at 967 W Bertrand St, Houston, TX 77088 and is currently estimated at $254,721, approximately $144 per square foot. 967 W Bertrand St is a home located in Harris County with nearby schools including Jerry Keeble Ec/Pre-K, Goodman Elementary School, and Aldine Ninth Grade School.
Ownership History
Date
Name
Owned For
Owner Type
Purchase Details
Closed on
Aug 29, 1997
Sold by
Kunati Rajeev K and Kunati Bindu
Bought by
Lozano Mario and Lozano Maria
Current Estimated Value
Home Financials for this Owner
Home Financials are based on the most recent Mortgage that was taken out on this home.
Original Mortgage
$54,350
Interest Rate
7.43%
Purchase Details
Closed on
Oct 28, 1993
Sold by
Jannapureddy Gopal R and Vanaja Jannapureddy J
Bought by
Kunati Rajeev K
Home Financials for this Owner
Home Financials are based on the most recent Mortgage that was taken out on this home.
Original Mortgage
$59,850
Interest Rate
6.96%
Purchase Details
Closed on
Sep 26, 1979
Sold by
Salinas Ted G and Salinas Betty Jo
Bought by
Jannapureddy Gopal R and Vanaja Jannapureddy J
Home Financials for this Owner
Home Financials are based on the most recent Mortgage that was taken out on this home.
Original Mortgage
$37,750
Interest Rate
6.96%
Mortgage Type
Seller Take Back
Create a Home Valuation Report for This Property
The Home Valuation Report is an in-depth analysis detailing your home's value as well as a comparison with similar homes in the area
Home Values in the Area
Average Home Value in this Area
Purchase History
| Date | Buyer | Sale Price | Title Company |
|---|---|---|---|
| Lozano Mario | -- | Regency Title | |
| Kunati Rajeev K | -- | -- | |
| Jannapureddy Gopal R | -- | First American Title Company |
Source: Public Records
Mortgage History
| Date | Status | Borrower | Loan Amount |
|---|---|---|---|
| Closed | Lozano Mario | $54,350 | |
| Previous Owner | Kunati Rajeev K | $59,850 | |
| Previous Owner | Jannapureddy Gopal R | $37,750 |
Source: Public Records
Tax History Compared to Growth
Tax History
| Year | Tax Paid | Tax Assessment Tax Assessment Total Assessment is a certain percentage of the fair market value that is determined by local assessors to be the total taxable value of land and additions on the property. | Land | Improvement |
|---|---|---|---|---|
| 2025 | $3,187 | $281,335 | $63,965 | $217,370 |
| 2024 | $3,187 | $278,797 | $45,690 | $233,107 |
| 2023 | $3,187 | $285,892 | $45,690 | $240,202 |
| 2022 | $4,111 | $228,931 | $39,730 | $189,201 |
| 2021 | $3,914 | $200,025 | $21,852 | $178,173 |
| 2020 | $3,739 | $200,025 | $21,852 | $178,173 |
| 2019 | $3,563 | $148,449 | $21,852 | $126,597 |
| 2018 | $1,322 | $142,276 | $21,852 | $120,424 |
| 2017 | $2,823 | $133,073 | $21,852 | $111,221 |
| 2016 | $2,566 | $133,073 | $21,852 | $111,221 |
| 2015 | $1,727 | $118,120 | $21,852 | $96,268 |
| 2014 | $1,727 | $97,176 | $21,852 | $75,324 |
Source: Public Records
Map
Nearby Homes
- 954 W Bertrand St
- 8718 Glen Shadow Dr
- 1314 Tarberry Rd
- 9006 Winding River Dr
- 9018 Lazy River Ln
- 9022 Indian River Dr
- 1307 Saddle Rock Dr
- 0 Grenshaw
- 0 Marcolin St
- 8602 De Priest St
- 8615 Citation Ct
- 958 Conklin St
- 0 Marjorie
- 1559 Diplomat Way
- 769 Marjorie St
- 905 Ferguson Way
- 907 Ferguson Way
- 8314 De Priest St
- 854 Junell St
- 1011 Beaver Bend Rd
- 963 W Bertrand St
- 1003 W Bertrand St
- 959 W Bertrand St
- 1007 W Bertrand St
- 1011 W Bertrand St
- 955 W Bertrand St
- 1002 W Bertrand St
- 958 W Bertrand St
- 951 W Bertrand St
- 1006 W Bertrand St
- 1015 W Bertrand St
- 1010 W Bertrand St
- 950 W Bertrand St
- 947 W Bertrand St
- 1019 W Bertrand St
- 1003 W Mierianne St
- 1014 W Bertrand St
- 946 W Bertrand St
- 959 W Mierianne St
- 1007 W Mierianne St