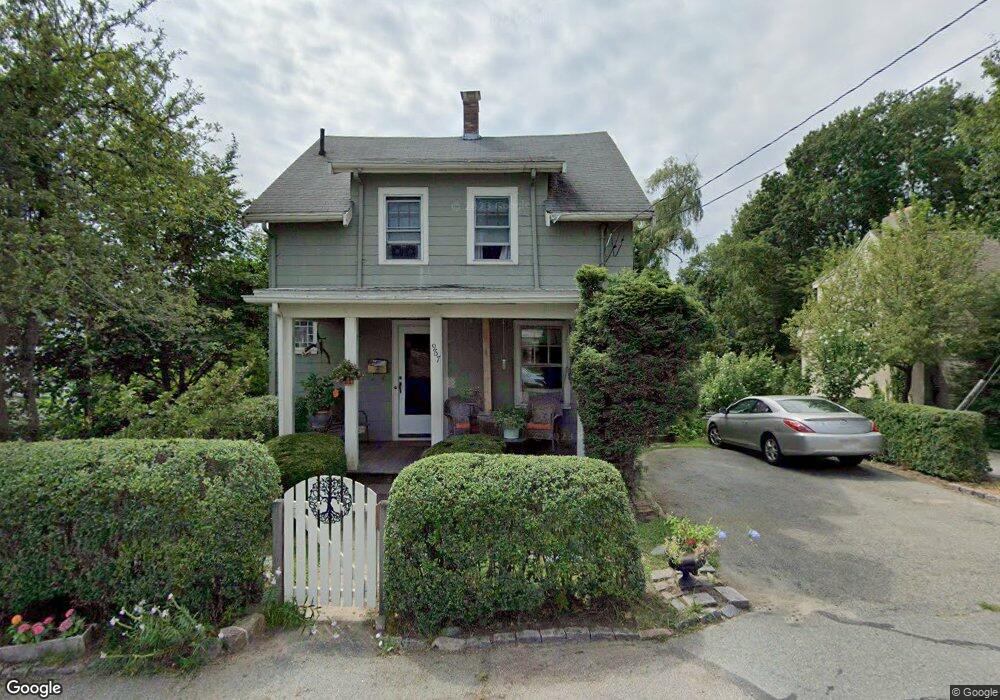
967 Webster St Needham, MA 02492
Estimated Value: $996,000 - $1,129,000
3
Beds
2
Baths
1,189
Sq Ft
$916/Sq Ft
Est. Value
About This Home
This home is located at 967 Webster St, Needham, MA 02492 and is currently estimated at $1,089,527, approximately $916 per square foot. 967 Webster St is a home located in Norfolk County with nearby schools including Newman Elementary School, High Rock Middle School, and Pollard Middle School.
Ownership History
Date
Name
Owned For
Owner Type
Purchase Details
Closed on
May 26, 1989
Sold by
Legere Alderice
Bought by
Hebard William G
Current Estimated Value
Purchase Details
Closed on
Mar 31, 1987
Sold by
Tomaino Frank
Bought by
Legere Alderice
Create a Home Valuation Report for This Property
The Home Valuation Report is an in-depth analysis detailing your home's value as well as a comparison with similar homes in the area
Home Values in the Area
Average Home Value in this Area
Purchase History
We collect this data history from publicly available records. To have your information removed, we recommend requesting removal directly through your county’s website.
| Date | Buyer | Sale Price | Title Company |
|---|---|---|---|
| Hebard William G | $185,000 | -- | |
| Hebard William G | $185,000 | -- | |
| Legere Alderice | $160,000 | -- |
Source: Public Records
Mortgage History
We collect this data history from publicly available records. To have your information removed, we recommend requesting removal directly through your county’s website.
| Date | Status | Borrower | Loan Amount |
|---|---|---|---|
| Open | Legere Alderice | $250,000 | |
| Closed | Legere Alderice | $124,000 |
Source: Public Records
Tax History
| Year | Tax Paid | Tax Assessment Tax Assessment Total Assessment is a certain percentage of the fair market value that is determined by local assessors to be the total taxable value of land and additions on the property. | Land | Improvement |
|---|---|---|---|---|
| 2025 | $9,356 | $882,600 | $683,300 | $199,300 |
| 2024 | $10,162 | $811,700 | $496,200 | $315,500 |
| 2023 | $10,268 | $787,400 | $496,200 | $291,200 |
| 2022 | $9,879 | $738,900 | $459,600 | $279,300 |
| 2021 | $9,628 | $738,900 | $459,600 | $279,300 |
| 2020 | $9,264 | $741,700 | $459,600 | $282,100 |
| 2019 | $8,596 | $693,800 | $418,000 | $275,800 |
| 2018 | $8,242 | $693,800 | $418,000 | $275,800 |
| 2017 | $7,862 | $661,200 | $418,000 | $243,200 |
| 2016 | $7,630 | $661,200 | $418,000 | $243,200 |
| 2015 | $7,465 | $661,200 | $418,000 | $243,200 |
| 2014 | $6,940 | $596,200 | $363,800 | $232,400 |
Source: Public Records
Map
Nearby Homes
- 46 Howland St Unit 46
- 238 Harris Ave
- 64 Gayland Rd
- 131 Fair Oaks Park
- 456 Chestnut St
- 11 Mayo Ave
- 19 Oakland Ave Unit 19
- 19 Oakland Ave
- 105 Blake St
- 72 Marked Tree Rd
- 19 Marked Tree Rd
- 36 Upland Rd
- 52 Beaufort Ave
- 28 Green St
- 277 Brookline St
- 430 High Rock St
- 5 Colonial Rd
- 957 South St
- 60 Tudor Rd
- 277 Rosemary St
- 19 Howland St
- 981 Webster St
- 981 Webster St Unit 981
- 23 Howland St
- 983 Webster St
- 961 Webster St
- 989 Webster St
- 978 Webster St
- 29 Howland St
- 962 Webster St
- 968 Webster St
- 955 Webster St
- 39 Howland St
- 954 Webster St
- 984 Webster St
- 30 Howland St
- 952 Webster St
- 990 Webster St
- 947 Webster St
- 36 Howland St
Your Personal Tour Guide
Ask me questions while you tour the home.