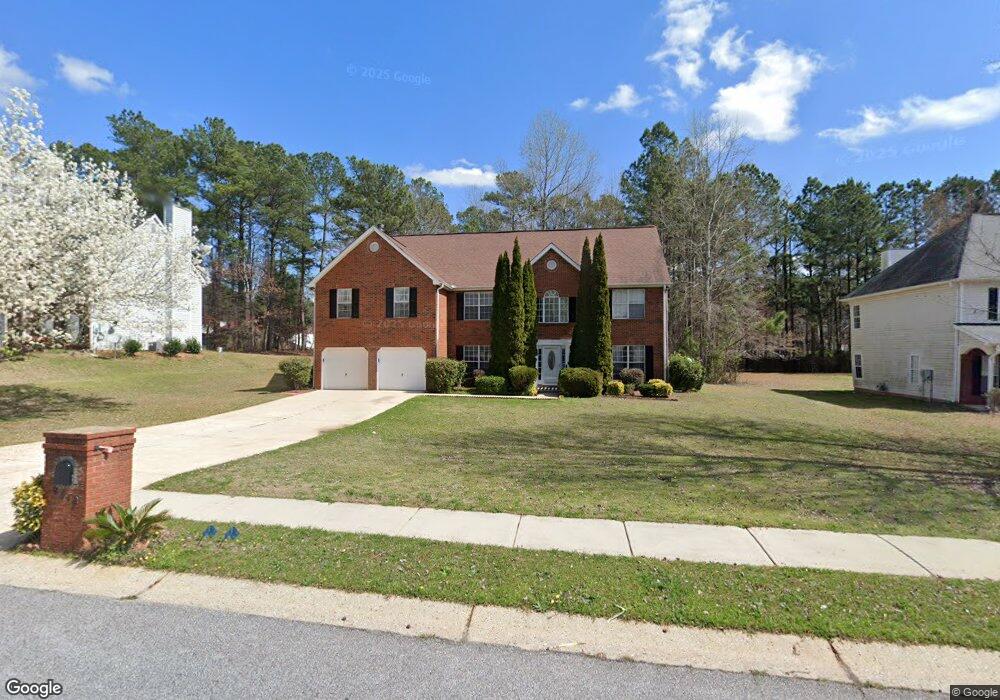
9672 Carolina Dr Jonesboro, GA 30238
Estimated Value: $342,889 - $381,000
4
Beds
3
Baths
3,213
Sq Ft
$113/Sq Ft
Est. Value
About This Home
This home is located at 9672 Carolina Dr, Jonesboro, GA 30238 and is currently estimated at $363,222, approximately $113 per square foot. 9672 Carolina Dr is a home located in Clayton County with nearby schools including Kemp Primary School, Kemp Elementary School, and Mundys Mill Middle School.
Ownership History
Date
Name
Owned For
Owner Type
Purchase Details
Closed on
May 15, 2017
Sold by
Lucien Delouis
Bought by
Charles Natacha
Current Estimated Value
Purchase Details
Closed on
Nov 19, 2008
Sold by
Cwabs Inc Series 2006-22
Bought by
Delouis Lucien
Home Financials for this Owner
Home Financials are based on the most recent Mortgage that was taken out on this home.
Original Mortgage
$126,332
Interest Rate
5.29%
Mortgage Type
FHA
Purchase Details
Closed on
Jul 1, 2008
Sold by
Powell Anna L
Bought by
Cwabs Inc Series 2006-22
Purchase Details
Closed on
Jan 26, 1998
Sold by
First Dimension Homes
Bought by
Gaillard Michael S
Home Financials for this Owner
Home Financials are based on the most recent Mortgage that was taken out on this home.
Original Mortgage
$160,701
Interest Rate
6.86%
Mortgage Type
VA
Create a Home Valuation Report for This Property
The Home Valuation Report is an in-depth analysis detailing your home's value as well as a comparison with similar homes in the area
Home Values in the Area
Average Home Value in this Area
Purchase History
| Date | Buyer | Sale Price | Title Company |
|---|---|---|---|
| Charles Natacha | -- | -- | |
| Delouis Lucien | $128,000 | -- | |
| Cwabs Inc Series 2006-22 | $115,760 | -- | |
| Gaillard Michael S | $1,570,000 | -- |
Source: Public Records
Mortgage History
| Date | Status | Borrower | Loan Amount |
|---|---|---|---|
| Previous Owner | Delouis Lucien | $126,332 | |
| Previous Owner | Gaillard Michael S | $160,701 |
Source: Public Records
Tax History Compared to Growth
Tax History
| Year | Tax Paid | Tax Assessment Tax Assessment Total Assessment is a certain percentage of the fair market value that is determined by local assessors to be the total taxable value of land and additions on the property. | Land | Improvement |
|---|---|---|---|---|
| 2024 | $2,264 | $124,680 | $8,800 | $115,880 |
| 2023 | $4,662 | $129,120 | $8,800 | $120,320 |
| 2022 | $2,063 | $115,200 | $8,800 | $106,400 |
| 2021 | $1,591 | $89,680 | $8,800 | $80,880 |
| 2020 | $2,869 | $80,780 | $8,800 | $71,980 |
| 2019 | $2,572 | $72,412 | $7,600 | $64,812 |
| 2018 | $2,376 | $67,589 | $7,600 | $59,989 |
| 2017 | $2,709 | $65,643 | $7,600 | $58,043 |
| 2016 | $2,442 | $59,090 | $7,600 | $51,490 |
| 2015 | $2,122 | $0 | $0 | $0 |
| 2014 | $1,600 | $49,260 | $7,600 | $41,660 |
Source: Public Records
Map
Nearby Homes
- 9620 Carolina Dr
- 9744 Carolina Dr
- 9531 Winding Way Ln
- 1131 Orr Rd
- 6632 Chason Woods Ct
- 1157 Mundys Mill Rd
- 6637 Chason Woods Ct
- 1352 Riverstone Rd Unit 104
- 1364 Riverstone Rd Unit 99
- 1366 Riverstone Rd Unit 98
- 1362 Riverstone Rd Unit LOT 100
- 1366 Riverstone Rd
- 1360 Riverstone Rd Unit LOT 101
- 1352 Riverstone Rd
- 1239 Riverstone Rd
- 1262 Riverstone Rd
- 1234 Riverstone Rd
- 1250 Riverstone Rd
- 1256 Riverstone Rd
- 9662 Carolina Dr
- 9684 Carolina Dr
- 9671 Winding Way Ln Unit 3
- 9652 Carolina Dr
- 9652 Carolina Dr Unit 13
- 9661 Winding Way Ln Unit 3
- 9694 Carolina Dr
- 9683 Winding Way Ln
- 9673 Carolina Dr
- 9663 Carolina Dr Unit 3
- 9685 Carolina Dr Unit 3
- 9651 Winding Way Ln
- 9693 Winding Way Ln
- 9640 Carolina Dr Unit 2
- 9704 Carolina Dr
- 9653 Carolina Dr
- 9695 Carolina Dr Unit 3
- 9639 Winding Way Ln Unit 3
- 9703 Winding Way Ln Unit 3
- 9641 Carolina Dr