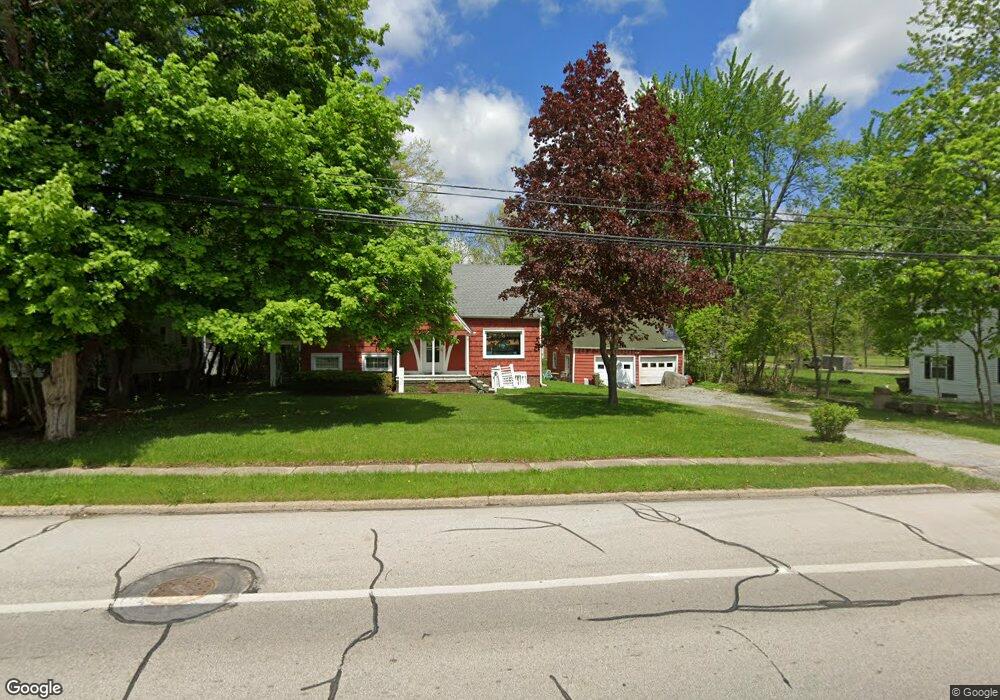
9673 E Center St Windham, OH 44288
Estimated Value: $158,000 - $172,000
3
Beds
1
Bath
1,745
Sq Ft
$94/Sq Ft
Est. Value
About This Home
This home is located at 9673 E Center St, Windham, OH 44288 and is currently estimated at $164,541, approximately $94 per square foot. 9673 E Center St is a home located in Portage County with nearby schools including Katherine Thomas Elementary School, Windham Junior High School, and Windham High School.
Ownership History
Date
Name
Owned For
Owner Type
Purchase Details
Closed on
Oct 25, 2024
Sold by
Delaney Mary S
Bought by
Bello Terry L and Bello Donald L
Current Estimated Value
Home Financials for this Owner
Home Financials are based on the most recent Mortgage that was taken out on this home.
Original Mortgage
$132,000
Outstanding Balance
$130,777
Interest Rate
6.5%
Mortgage Type
New Conventional
Estimated Equity
$33,764
Purchase Details
Closed on
Nov 10, 2022
Sold by
Sterpka Martin
Bought by
Delaney Mary S
Purchase Details
Closed on
Dec 9, 2021
Sold by
Delaney Mary S
Bought by
Mary M Sterpka
Purchase Details
Closed on
Oct 18, 2021
Sold by
Sterpka Mary M
Bought by
Sterpka Martin
Purchase Details
Closed on
Oct 14, 2021
Sold by
Delaney Mary S
Bought by
Sterpka Mary M
Purchase Details
Closed on
Feb 17, 2020
Sold by
Sterpka Mary M
Bought by
Delaney Mary S
Purchase Details
Closed on
Jan 1, 1990
Bought by
Sterpka Lawrence R and Sterpka Mary M
Create a Home Valuation Report for This Property
The Home Valuation Report is an in-depth analysis detailing your home's value as well as a comparison with similar homes in the area
Home Values in the Area
Average Home Value in this Area
Purchase History
| Date | Buyer | Sale Price | Title Company |
|---|---|---|---|
| Bello Terry L | $165,000 | Infinity Title | |
| Delaney Mary S | -- | -- | |
| Mary M Sterpka | -- | -- | |
| Sterpka Martin | -- | None Available | |
| Sterpka Mary M | -- | None Available | |
| Delaney Mary S | -- | None Available | |
| Sterpka Lawrence R | -- | -- |
Source: Public Records
Mortgage History
| Date | Status | Borrower | Loan Amount |
|---|---|---|---|
| Open | Bello Terry L | $132,000 |
Source: Public Records
Tax History Compared to Growth
Tax History
| Year | Tax Paid | Tax Assessment Tax Assessment Total Assessment is a certain percentage of the fair market value that is determined by local assessors to be the total taxable value of land and additions on the property. | Land | Improvement |
|---|---|---|---|---|
| 2024 | $2,055 | $48,870 | $6,060 | $42,810 |
| 2023 | $1,976 | $41,760 | $6,020 | $35,740 |
| 2022 | $1,889 | $41,760 | $6,020 | $35,740 |
| 2021 | $1,866 | $41,760 | $6,020 | $35,740 |
| 2020 | $1,055 | $30,910 | $4,620 | $26,290 |
| 2019 | $1,082 | $30,910 | $4,620 | $26,290 |
| 2018 | $1,046 | $30,320 | $4,870 | $25,450 |
| 2017 | $1,046 | $30,320 | $4,870 | $25,450 |
| 2016 | $1,037 | $30,320 | $4,870 | $25,450 |
| 2015 | $1,037 | $30,320 | $4,870 | $25,450 |
| 2014 | $1,104 | $31,650 | $4,870 | $26,780 |
| 2013 | $1,092 | $31,650 | $4,870 | $26,780 |
Source: Public Records
Map
Nearby Homes
- 9008 Wilverne Dr
- 9093 Wilverne Dr
- 8935 S Main St
- 9137 Maple Grove Rd
- 9313 W Center St
- 9626 Windham Parkman Rd
- VL Bryant Rd
- V/L Parkman Rd
- 0 Bryant & Sr 82
- 0 Bryant Rd
- 8460 Gotham Rd
- 8421 Gotham Rd
- 10453 Windham Parkman Rd
- 10168 Stanley Rd
- 1534 Newton Falls Portage Rd
- 7795 Ohio 303
- 0 State Route 5 Unit 5085736
- 9268 Slagle Rd
- 10318 Liberty St
- 8406 Eagle Creek Dr
- 9665 E Center St
- 9679 E Center St
- 9659 E Center St
- 9653 E Center St
- 9650 E Center St
- 8972 Maple Grove Rd
- 9725 Grove Ct
- 9709 Grove Ct
- 9717 Grove Ct
- VL State Route 303
- 9626 E Center St
- 9626 E Center St
- 9630 E Center St
- 9008 Maple Grove Rd
- 8992 Maple Grove Rd
- 9720 Grove Ct
- VL Center St
- 8998 Maple Grove Rd
- 8916 Woodlawn Terrace
- 9736 E Center St