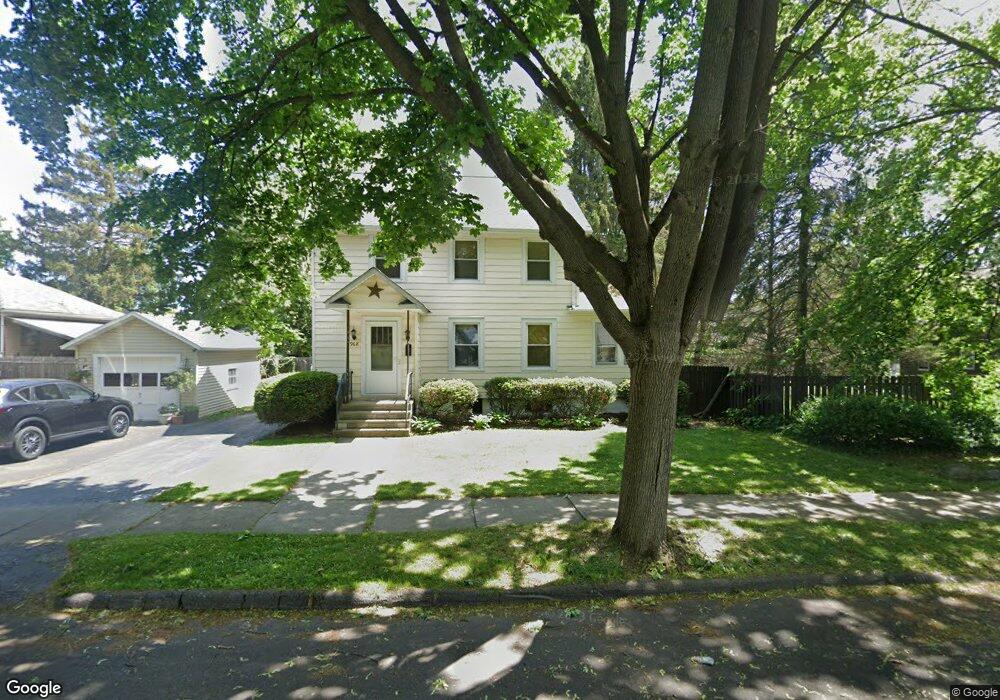
968 Farnham St Elmira, NY 14901
Estimated Value: $126,000 - $150,000
3
Beds
1
Bath
1,776
Sq Ft
$76/Sq Ft
Est. Value
About This Home
This home is located at 968 Farnham St, Elmira, NY 14901 and is currently estimated at $135,451, approximately $76 per square foot. 968 Farnham St is a home located in Chemung County with nearby schools including Fassett Elementary School, Thomas K. Beecher School, and Broadway Academy.
Ownership History
Date
Name
Owned For
Owner Type
Purchase Details
Closed on
Oct 6, 2016
Sold by
Lincoln Stephen M
Bought by
Lincoln Jamie L
Current Estimated Value
Purchase Details
Closed on
Apr 6, 2009
Sold by
Krystof Vincent F
Bought by
Lincoln Stephen M
Home Financials for this Owner
Home Financials are based on the most recent Mortgage that was taken out on this home.
Original Mortgage
$60,000
Outstanding Balance
$37,930
Interest Rate
4.94%
Mortgage Type
Purchase Money Mortgage
Estimated Equity
$97,521
Purchase Details
Closed on
Mar 8, 2005
Sold by
Krystof Helen
Bought by
Krystof Vincent
Purchase Details
Closed on
Jun 15, 2004
Create a Home Valuation Report for This Property
The Home Valuation Report is an in-depth analysis detailing your home's value as well as a comparison with similar homes in the area
Home Values in the Area
Average Home Value in this Area
Purchase History
| Date | Buyer | Sale Price | Title Company |
|---|---|---|---|
| Lincoln Jamie L | -- | Peter F. Finnerty | |
| Lincoln Stephen M | $65,000 | John W Maloney | |
| Krystof Vincent | -- | -- | |
| -- | -- | -- |
Source: Public Records
Mortgage History
| Date | Status | Borrower | Loan Amount |
|---|---|---|---|
| Open | Lincoln Stephen M | $60,000 |
Source: Public Records
Tax History Compared to Growth
Tax History
| Year | Tax Paid | Tax Assessment Tax Assessment Total Assessment is a certain percentage of the fair market value that is determined by local assessors to be the total taxable value of land and additions on the property. | Land | Improvement |
|---|---|---|---|---|
| 2024 | $3,999 | $65,000 | $8,400 | $56,600 |
| 2023 | $3,930 | $65,000 | $8,400 | $56,600 |
| 2022 | $2,302 | $65,000 | $8,400 | $56,600 |
| 2021 | $1,665 | $65,000 | $8,400 | $56,600 |
| 2020 | $1,845 | $65,000 | $8,400 | $56,600 |
| 2019 | $751 | $65,000 | $8,400 | $56,600 |
| 2018 | $3,857 | $65,000 | $8,400 | $56,600 |
| 2017 | $1,703 | $65,000 | $8,400 | $56,600 |
| 2016 | $1,691 | $65,000 | $8,400 | $56,600 |
| 2015 | -- | $65,000 | $8,400 | $56,600 |
| 2014 | -- | $65,000 | $8,400 | $56,600 |
Source: Public Records
Map
Nearby Homes