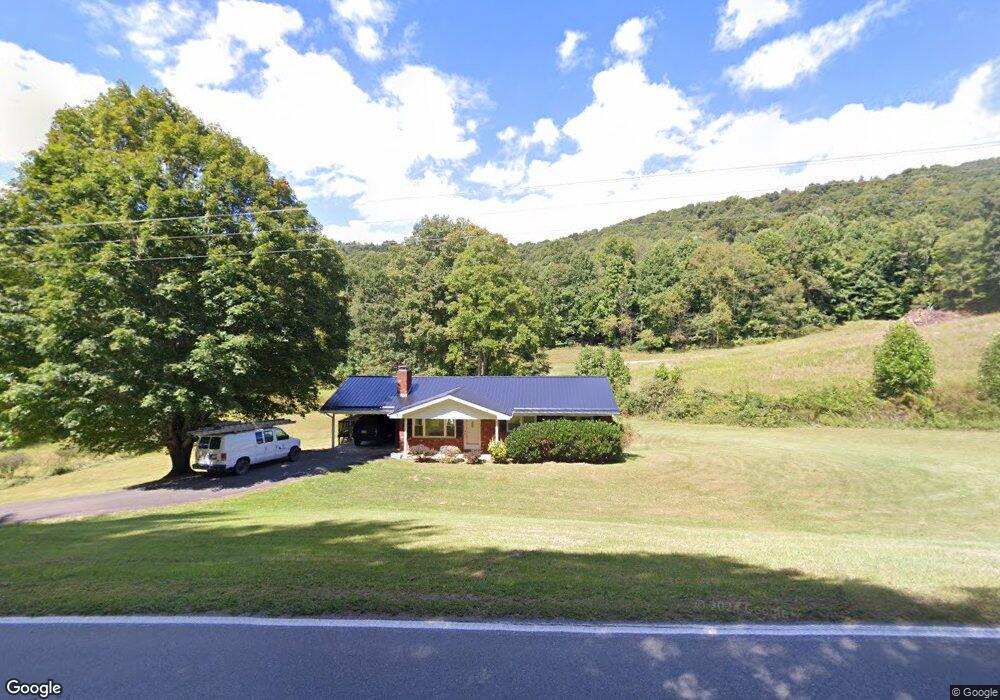
968 Lower Nettle Knob Rd West Jefferson, NC 28694
Estimated Value: $466,000 - $764,517
--
Bed
--
Bath
2,048
Sq Ft
$267/Sq Ft
Est. Value
About This Home
This home is located at 968 Lower Nettle Knob Rd, West Jefferson, NC 28694 and is currently estimated at $545,879, approximately $266 per square foot. 968 Lower Nettle Knob Rd is a home with nearby schools including Ashe County High School.
Ownership History
Date
Name
Owned For
Owner Type
Purchase Details
Closed on
Feb 11, 2022
Sold by
Lawrnw John S
Bought by
City Lane Town Llc
Current Estimated Value
Purchase Details
Closed on
Nov 19, 2020
Sold by
Lovell Burley Travus and Lovell Amanda C
Bought by
Greene John S and Greene Lauren W
Purchase Details
Closed on
Feb 23, 2017
Sold by
Brooks Helen and Lovell Helen B
Bought by
Lovell Burley Travus and Lovell Amanda C
Purchase Details
Closed on
Oct 6, 2008
Sold by
Friend Susan and Smith Henry
Bought by
Lovell Burlery Turrell and Lovell Helen L
Home Financials for this Owner
Home Financials are based on the most recent Mortgage that was taken out on this home.
Original Mortgage
$50,000
Interest Rate
6.36%
Mortgage Type
Credit Line Revolving
Create a Home Valuation Report for This Property
The Home Valuation Report is an in-depth analysis detailing your home's value as well as a comparison with similar homes in the area
Home Values in the Area
Average Home Value in this Area
Purchase History
| Date | Buyer | Sale Price | Title Company |
|---|---|---|---|
| City Lane Town Llc | -- | None Listed On Document | |
| Greene John S | $260,000 | None Available | |
| Lovell Burley Travus | -- | None Available | |
| Lovell Burlery Turrell | $245,000 | -- |
Source: Public Records
Mortgage History
| Date | Status | Borrower | Loan Amount |
|---|---|---|---|
| Previous Owner | Lovell Burlery Turrell | $50,000 |
Source: Public Records
Tax History Compared to Growth
Tax History
| Year | Tax Paid | Tax Assessment Tax Assessment Total Assessment is a certain percentage of the fair market value that is determined by local assessors to be the total taxable value of land and additions on the property. | Land | Improvement |
|---|---|---|---|---|
| 2025 | $3,057 | $606,600 | $363,000 | $243,600 |
| 2024 | $2,727 | $563,400 | $363,000 | $200,400 |
| 2023 | $2,727 | $563,400 | $363,000 | $200,400 |
| 2022 | $864 | $129,900 | $34,800 | $95,100 |
| 2021 | $864 | $129,900 | $34,800 | $95,100 |
| 2020 | $777 | $129,900 | $34,800 | $95,100 |
| 2019 | $762 | $129,900 | $34,800 | $95,100 |
| 2018 | $754 | $132,300 | $34,800 | $97,500 |
| 2016 | $756 | $132,300 | $34,800 | $97,500 |
| 2015 | $745 | $132,300 | $34,800 | $97,500 |
| 2014 | $745 | $139,800 | $34,800 | $105,000 |
Source: Public Records
Map
Nearby Homes
- 3247 Water Tank Rd
- TBD Long View Dr
- 126 Lower Nettle Knob Rd
- Tbd Beaver Creek Dr
- TBD Lake Circle St
- 255 Lakeside Dr
- 162 Carrie Dillard Rd
- 321 Shady Oak Ln
- 300 Shady Oak Ln
- 195 Finch Way
- 195 Finch Way Unit 7
- 177 Finch Way
- 108 Finch Way
- TBD Apple Canyon Dr
- TBD Sharpes Mountain Ln
- 25 Monticello Dr
- 637 Monticello Dr
- 288 Monticello Dr
- Lot 25 Monticello Dr Unit 25
- 0 Monticello Dr Unit CAR4303996
- 1075 Lower Nettle Knob Rd
- 1090 Lower Nettle Knob Rd
- 1091 Lower Nettle Knob Rd
- 1155 Lower Nettle Knob Rd
- 871 Lower Nettle Knob Rd
- 1236 Lower Nettle Knob Rd
- 1190 Lower Nettle Knob Rd
- 1240 Lower Nettle Knob Rd
- 325 Maple Ridge Estates Dr
- 1272 Lower Nettle Knob Rd
- 3435 Water Tank Rd
- 3387 Water Tank Rd
- 3399 Water Tank Rd
- 1345 Lower Nettle Knob Rd
- 287 Maple Ridge Estates Dr
- 218 Jeannette Glen
- TBD Lot # 2 Jeannette Glen Rd
- TBD Lot # 1 & 2 Jeanette Glen Rd
- TBD Lot # 1 Jeannette Glen Rd
- 3325 Water Tank Rd