9684 Transue Ln SE Port Orchard, WA 98367
Estimated Value: $655,000 - $753,000
4
Beds
2
Baths
2,112
Sq Ft
$333/Sq Ft
Est. Value
About This Home
This home is located at 9684 Transue Ln SE, Port Orchard, WA 98367 and is currently estimated at $704,009, approximately $333 per square foot. 9684 Transue Ln SE is a home located in Kitsap County with nearby schools including Mullenix Ridge Elementary School, John Sedgwick Middle School, and South Kitsap High School.
Ownership History
Date
Name
Owned For
Owner Type
Purchase Details
Closed on
Dec 7, 2005
Sold by
Pennington Carl and Pennington Chyrel
Bought by
Ward Dwayne O and Ward Patricia L
Current Estimated Value
Home Financials for this Owner
Home Financials are based on the most recent Mortgage that was taken out on this home.
Original Mortgage
$225,500
Outstanding Balance
$129,024
Interest Rate
5.75%
Mortgage Type
New Conventional
Estimated Equity
$574,985
Purchase Details
Closed on
Dec 10, 2004
Sold by
Johnson Barry D
Bought by
Pennington Carl and Pennington Chyrel
Purchase Details
Closed on
Aug 29, 2003
Sold by
Johnson Barry D
Bought by
Johnson Barry D
Purchase Details
Closed on
Feb 24, 1998
Sold by
Western United Life Assurance Company
Bought by
Johnson Barry
Create a Home Valuation Report for This Property
The Home Valuation Report is an in-depth analysis detailing your home's value as well as a comparison with similar homes in the area
Home Values in the Area
Average Home Value in this Area
Purchase History
| Date | Buyer | Sale Price | Title Company |
|---|---|---|---|
| Ward Dwayne O | $20,280 | Transnation Title Ins Co | |
| Pennington Carl | $40,000 | Transnation Title | |
| Johnson Barry D | -- | -- | |
| Johnson Barry | -- | -- |
Source: Public Records
Mortgage History
| Date | Status | Borrower | Loan Amount |
|---|---|---|---|
| Open | Ward Dwayne O | $225,500 |
Source: Public Records
Tax History Compared to Growth
Tax History
| Year | Tax Paid | Tax Assessment Tax Assessment Total Assessment is a certain percentage of the fair market value that is determined by local assessors to be the total taxable value of land and additions on the property. | Land | Improvement |
|---|---|---|---|---|
| 2026 | $4,835 | $553,450 | $139,210 | $414,240 |
| 2025 | $4,835 | $553,450 | $139,210 | $414,240 |
| 2024 | $4,689 | $553,450 | $139,210 | $414,240 |
| 2023 | $4,658 | $553,450 | $139,210 | $414,240 |
| 2022 | $4,451 | $442,750 | $111,360 | $331,390 |
| 2021 | $4,133 | $388,510 | $99,430 | $289,080 |
| 2020 | $4,121 | $376,560 | $80,380 | $296,180 |
| 2019 | $3,493 | $349,910 | $74,590 | $275,320 |
| 2018 | $3,705 | $287,220 | $67,520 | $219,700 |
| 2017 | $3,160 | $287,220 | $67,520 | $219,700 |
| 2016 | $3,082 | $256,200 | $64,310 | $191,890 |
| 2015 | $2,976 | $250,640 | $64,310 | $186,330 |
| 2014 | -- | $244,190 | $64,350 | $179,840 |
| 2013 | -- | $244,190 | $64,350 | $179,840 |
Source: Public Records
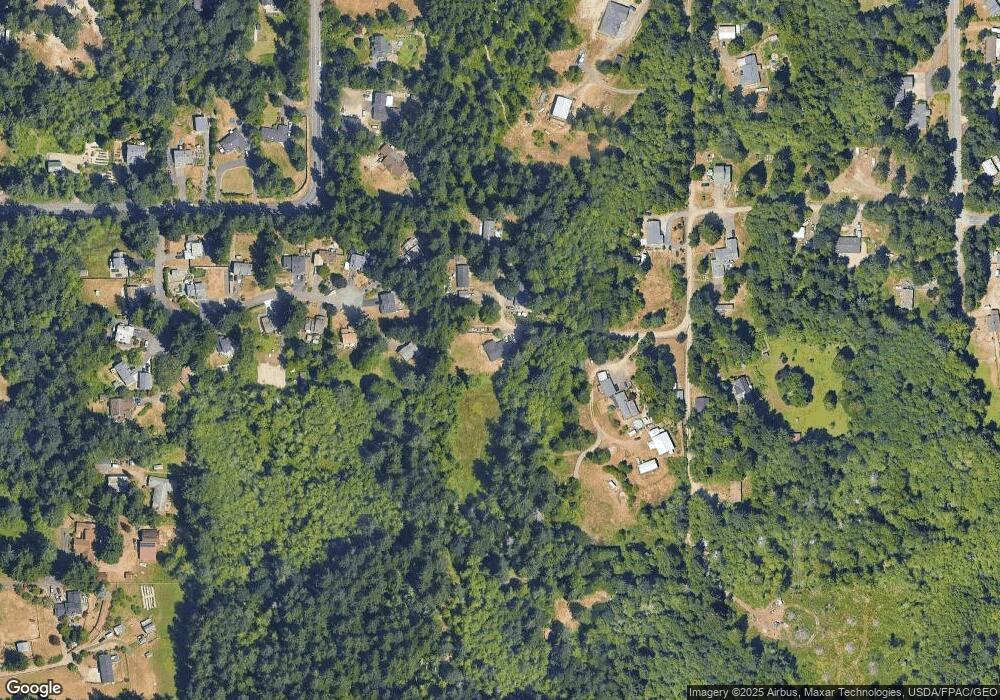
Map
Nearby Homes
- 8788 Deeridge Place SE
- 2995 SE Greenridge Ct
- 10379 Bethel Burley Rd SE
- 8621 Bethel Burley Rd SE
- 10668 Bethel Burley Rd SE
- 8423 Dormar Dr SE
- 8817 Clearwater Ln SE
- 7988 Bethel Burley Rd SE
- 10966 Branch Place SE
- 959 SE Spencer Ave
- 2670 SE Bielmeier Rd
- 7487 Bethel Burley Rd SE
- 9020 Wyvern Dr SE
- 9504 SW Caulfield Ln
- 8610 Long Lake Rd SE
- 0 Long Lake Rd SE Unit NWM2354075
- 3371 SE Bielmeier Rd Unit 95
- 3371 SE Bielmeier Rd Unit 85
- 3371 SE Bielmeier Rd Unit 91
- 3371 SE Bielmeier Rd Unit 79
- 9652 Transue Ln SE
- 9622 Sunburst Ct SE
- 9625 Sunburst Ct SE
- 9664 Transue Ln SE
- 9623 Sunburst Ct SE
- 9620 Sunburst Ct SE
- 9621 Sunburst Ct SE
- 9618 Sunburst Ct SE
- 9610 Transue Ln SE
- 9619 Sunburst Ct SE
- 9513 Horizon Ln SE
- 9616 Sunburst Ct SE
- 9617 Sunburst Ct SE
- 9305 Transue Ln SE
- 9695 Transue Ln SE
- 9500 Transue Ln SE
- 9495 Horizon Ln SE
- 9615 Sunburst Ct SE
- 9226 Transue Ln SE
- 9226 Transue Ln SE